by Eli Levine, Chavez Cheong, Ridge Ren, Emily Leung, Sam Wolter
Beginning in Summer 2021 as a Duke Data+ project and drawing on the research of Justina Zou in the 2019-20 academic year, the American Predatory Lending (APL) Data subteam aimed to take a data-driven approach to understanding the 2008 Global Financial Crisis (GFC) through analyzing the text in state Mortgage Enforcement Actions (MEAs). The general aims of the team were as follows:
This document details the methodology used to extract, process, analyze and present data from each state’s MEAs. To see the code used in the project, please refer to the team’s GitHub Repository.
State governments archive their MEAs in different formats. Some states store their MEAs as a list of links on their state enforcement agency’s website, while others have created databases allowing the public to search a person’s name and see any MEAs issued against that individual (this latter mode of accessible online archiving sought to empower borrowers by improving access to information about the integrity of lenders or their agents). This variation meant that we had to create two separate approaches, one that focused on web scraping and another that employed code that scraped the database for the relevant files.
Direct Downloads
On the relevant agency websites of many states, IT specialists store PDFs of MEAs as direct links in Excel files. To pull out these MEAs, we built a quick Python script with the Requests library, which was able to extract files rapidly and accurately. We applied this method to obtain PDFs from Arizona, Alaska, Oregon, Arkansas and Washington. One primary limitation of this approach emerged with states that have large amounts of MEAs; a small percentage of files failed to download. However, since this occasional error appeared to be randomly scattered and only occurred in states with comparatively numerous data points, we did not think it warranted a revision of our methods.
Selenium Scraping
As noted above, some states stored PDFs in online search databases that enable individual consumers or employers to examine the background of potential financial agents. In these cases, we contacted the states to obtain Excel lists of MEA records from 2000-2010 (where available), and used Selenium as a web scraping tool to automate the downloading of MEAS from the search databases. We used this method to obtain data from Ohio and Virginia.
Freedom of Information Act (FOIA)-Sourced Folders of PDFs
Some states do not make their MEAs publicly available. For these states, our team made state freedom of information act (FOIA) requests to obtain relevant files. A key shortcoming of this approach was that in most cases, we were not able to receive any metadata (additional information about MEAs such as the name of entities charged, the date, the type of MEA issued etc.) alongside MEAs, and this meant that metadata either had to be extracted manually or we had to pursue a process of automating metadata extraction (which created a number of logistical issues due to our lack of knowledge of the MEA’s structure). Thus, our team received Georgia’s MEAs through APL team member Jacob Argue’s FOIA request. We received a full folder of Georgia’s MEAs but did not receive any metadata alongside it.
Extracting Text from PDFs
To extract text from MEA PDFs, the Data subteam built an application interface around Amazon Web Services (AWS) Textract to automatically extract text from PDFs into a csv file. Figure 1 provides a visual depiction of the different components of the application interface, in sequence.
Figure 1 Workflow for AWS Text Extraction (Cheong, 2021)

Extracting Text from Webpages
While most states stored their MEAs as PDFs, some states stored their MEAs directly on web pages. In these cases, we were able to extract text directly from these webpages using BeautifulSoup, a Python package for web scraping. We obtained the text from Massachusetts MEAs in this manner.
Once we obtained, cleaned, and processed MEAs with the methods described above, we moved on to analyzing the data. Here, there were a few sub-steps that the team took: EDA, NLP and statutory analysis.
Exploratory Data Visualization and Metadata Analysis
To identify and analyze base trends in MEAs across different states, the Data team conducted exploratory data visualization using available metadata. The team made visualizations of the number of MEAs over time, the breakdown of MEAs by recipient entity type, and the breakdown of the type of enforcement action over time.
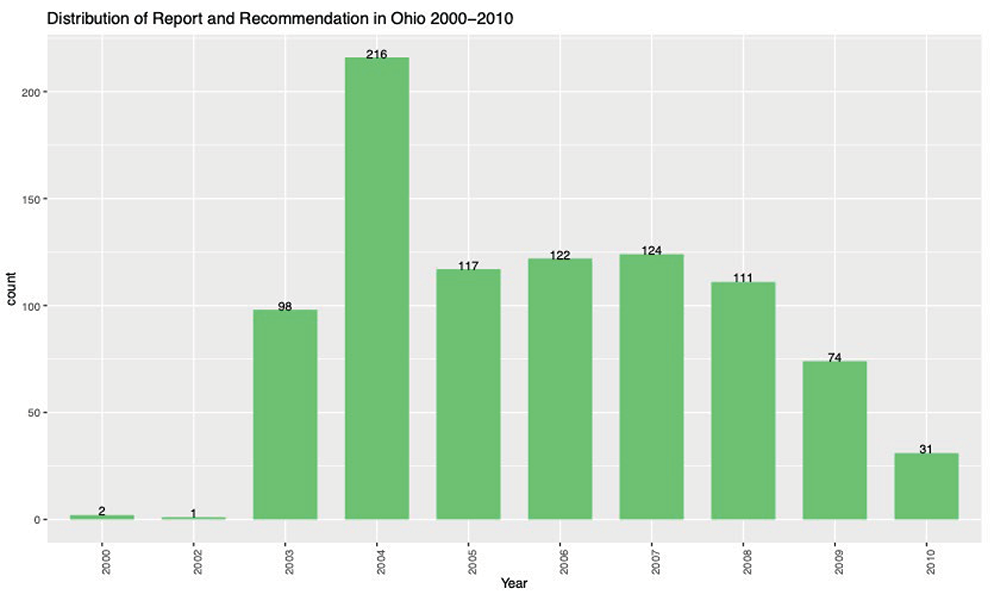
Figure 2 An example of EDA conducted to inform our perspective. This graph shows the distributions of MEA’s labeled as Report and Recommendations in Ohio over time (Levine, 2021).
We made use of 3 different data visualization platforms over the course of the project: R (ggplot2), Kibana, and Tableau. R was extremely flexible and thus was the platform of choice for generating static visualizations for each state report. However, the team also worked to create an interactive visualization, so that researchers could focus on data segments of interest and identify trends. Kibana proved especially valuable in dashboard prototyping since it facilitates the capacity of dashboard users to slice the data any way they wished and also provides in-built text tokenization[1] and lemmatization[2] purposes. However, while Kibana was effective as a standalone dashboard, it presented significant integration challenges when we explored options for deploying on the APL website. To mitigate this problem, the Data team replicated , preserving most of the features while also increasing portability of our visualizations.
We drew only on metadata for most of our preliminary EDA, which was facilitated by the fact that our initial datasets had relatively similar and complete metadata sets. As we expanded our analysis to include more states, however, the state-by-state differences among available metadata increased. As an example, across the states of Virginia, Washington and Arizona, metadata available differed, as seen in the table below.
Table 1 Metadata Differences between States Analyzed (Fall 2021)
| Metadata/State | Virginia | Washington | Arizona |
| Date | Present | Present | Present |
| Entity Type | Absent | Absent | Present |
| Entity Name | Present | Present | Present |
| Enforcement Action Type | Absent | Present | Present |
This variation limited comparative analysis; one potential workaround would use Named Entity Recognition on the textual data to associate entity types with specific documents.
Natural Language Processing
With a large portion of available data consisting of text, we turned to NLP as the most sensible method for large-scale textual analysis. Since analyzing patterns of the misconduct cited in the MEAs was a key goal, the team decided to focus on topic modeling, a process that classifies texts into different topics based on similarities in phrases used. A description of the workflow is shown below in Figure 3.
Figure 3: NLP Workflow (Cheong, Levine, 2021)

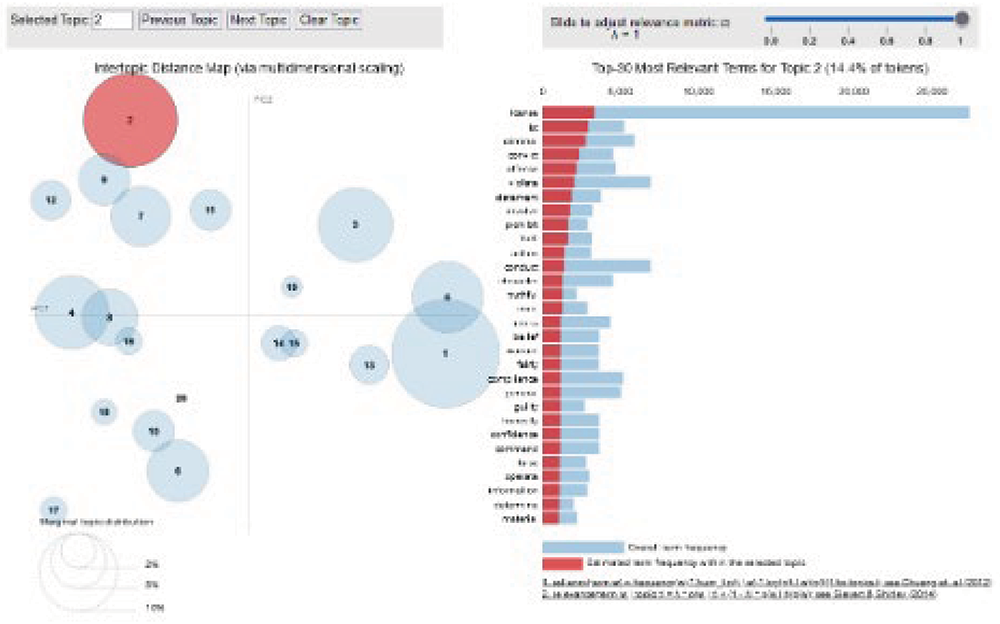
The team initially worked with a Python-based framework (Gensim and spaCy). We deployed spaCy because it had an excellent built-in lexicon of words and thus heavily automated the process of identifying individual words in text (tokenization) and standardizing tenses/word forms (lemmatization). Similarly, Gensim provided robust support for spaCY-processed texts, and provided high quality and effective visualization models for the team to better understand the coherence of generated topic models with Latent Dirichlet Allocation (LDA). Figure 4 provides an example of two related visualizations. On the left, we see a visual representation of the conceptual “distance” between different topics (how different one topic is from another). On the right, we see the format for the most common words in a selected topic.
Figure 4 PyLDA Visualization (Cheong, Levine, 2021)
However, spaCy has some shortcomings, chiefly around processing speed and voracious use of computer memory. After further exploration of alternatives, the team decided to shift to using the R-based quanteda software, a powerful NLP package. Reviews from industry users[3] suggest that quanteda is 50% faster than gensim and requires 40% less memory consumption. The following two charts compare execution speed and memory consumption between quanteda and gensim.
Figure 5 Execution and Memory Usage Comparison between Quanteda and Gensim (Watanabe, 2017)

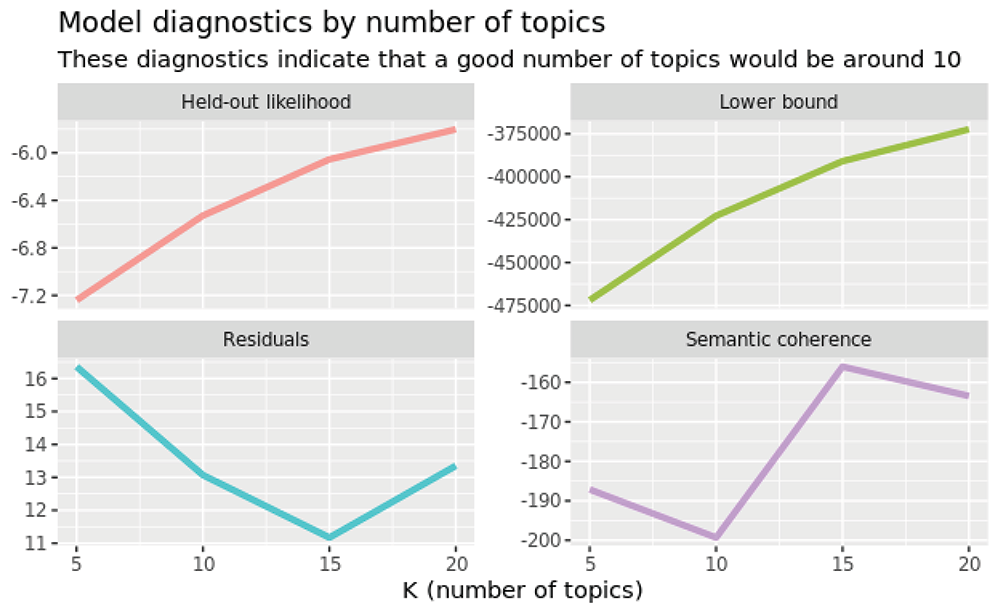
As an added benefit, Quanteda also provided many other metrics for determining topic model coherence for the selection of the number of topics.
Figure 6 Example of Topic Model metrics for Quanteda (Levine, 2021)
We faced two key challenges in applying NLP techniques like topic modeling to legal texts like MEAs:
The team solved these problems with two approaches:
These approaches had the downside of being prohibitively time-consuming and thus, it would be difficult to scale toward all documents across states. However, after meetings with different NLP experts, we concluded that within the space of NLP, at present there are no better alternatives.
Keyword Marking
A possibly simpler alternative that the Data sub-team devised involved identifying key phrases in text and leveraging the often-formulaic language in legal documents to our advantage. For instance, since every MEA will quote the exact laws the entity violated, with a dictionary of relevant regulations, we can search for MEAs that contain that specific law and tag documents accordingly. A potential limitation, still to be explored, is that certain states may be using the law as a means of explaining orders to cease activities without explicitly stating which subsections an entity was violating.
Statutory Analysis
To understand the analyzed MEAs, the team reviewed cited statutes when the MEAs included that level of detail. Because some of the relevant laws have been revised since the period under analysis, the team relied on annotated and historical state codes from Lexis and Westlaw to assess the substantive law as it existed at the time of enforcement. The team then summarized and explained the cited law(s) in plain language for inclusion into each state report.
Our analysis of many states shared similar methodologies at different steps, as they shared similar data storage structures or metadata. Since similar methods of data storage occurred across different states, the data team deemed it appropriate and effective to provide summary analysis for each state analyzed.
The states are listed as follows:
Alaska
| Number of MEAs | 72 |
| Years Collected | 2000-2010 |
| Metadata Available | Date, Entity Name, Entity Type, Enforcement Action Type |
| Methods of Extraction | Python Requests, AWS Textract |
| Visualized With | N.A. |
| NLP Platform | N.A. |
Arizona
| Number of MEAs | 86 |
| Years Collected | 2006-2010 |
| Metadata Available | Date, Entity Name, Entity Type, Enforcement Action Type |
| Methods of Extraction | Python Requests, AWS Textract |
| Visualized With | R – ggplot2 |
| NLP Platform | R – Quanteda |
Arkansas
| Number of MEAs | 86 |
| Years Collected | 2006-2010 |
| Metadata Available | Date, Entity Name, Entity Type, Enforcement Action Type |
| Methods of Extraction | Python – Requests, AWS – Textract |
| Visualized With | N.A. |
| NLP Platform | N.A. |
Massachusetts
| Number of MEAs | 353 |
| Years Collected | 2001-2010 |
| Metadata Available | Date, Entity Name, Entity Type, Enforcement Action Type |
| Methods of Extraction | BeautifulSoup |
| Visualized With | Kibana, Tableau |
| NLP Platform | Python – Gensim, spaCy |
Ohio
| Number of MEAs | 6905 |
| Years Collected | 2000-2010 |
| Metadata Available | Date, Entity Name, Entity Type, Enforcement Action Type |
| Methods of Extraction | Selenium, AWS – Textract |
| Visualized With | Kibana, Tableau |
| NLP Platform | Python – Gensim, spaCy |
Virginia
| Number of MEAs | 886 |
| Years Collected | 2006-2010 |
| Metadata Available | Date, Entity Name, Enforcement Action Type |
| Methods of Extraction | Selenium, AWS – Textract |
| Visualized With | R – ggplot2 |
| NLP Platform | R – tidyverse (Keyword Marking) |
Note: In scraping PDFs with Selenium, Virginia’s web page was significantly slower and also contained web elements that prevented clicking, hence we had to work around these issues with built-in sleep timers and percentage-based scroll markers.
Washington
| Number of MEAs | 556 |
| Years Collected | 2000-2010 |
| Metadata Available | Date, Entity Name, Entity Type, Enforcement Action Type |
| Methods of Extraction | Requests, AWS Textract |
| Visualized With | R – ggplot2 |
| NLP Platform | R – quanteda |
Appendix 1: Arizona
Figure 7 Model diagnostics to determine the appropriate number of topic models in Arizona

This sample plot from Quentada helps us determine the appropriate number of topics to use when sorting the documents by the relevant keywords. In all graphs we focused on the elbow points. “Held out likelihood” represents the likelihood that a model is accurate when tested against a held out set. Lower bound represents the lower bound for the rate of convergence. Residuals are the difference between observed and predicted number of topics. Semantic coherence measures the frequency of co-occurrence of words in a document. These diagnostics helped us decide that 10 was the appropriate number for Arizona.
Figure 8: Model Diagnostic Plots for Massachusetts. These are the coherence plot (top) and PyLDA visualization ( )
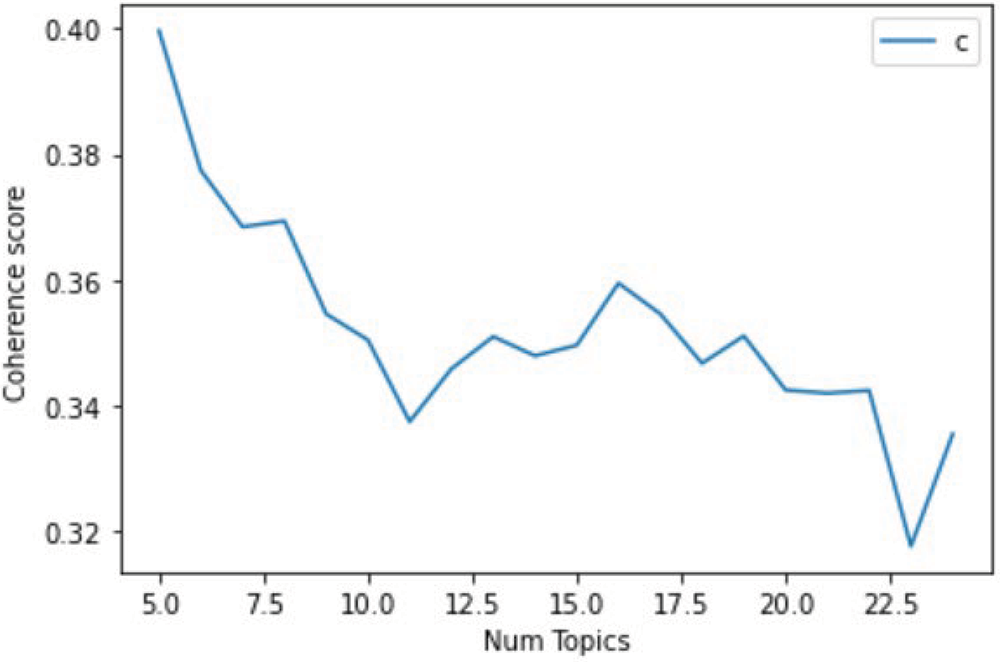
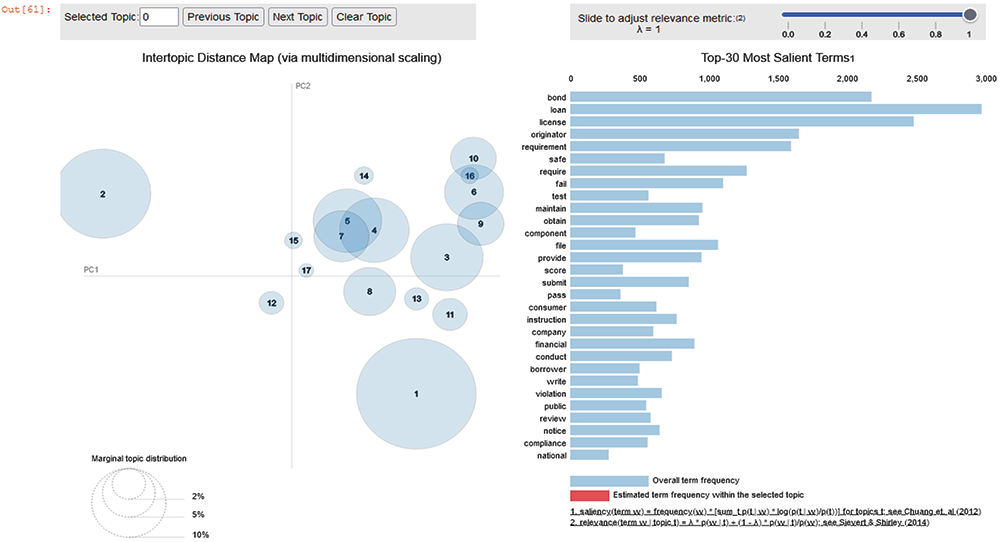
For Massachusetts, we chose 16 topics due to the spike at 0.36 coherence score. Although there were higher coherence scores for 10 topics or less, we found through pyLDAvis that there were too few topics for us to be able to classify different types of offenses effectively and in a way that enabled analysis. This was a compromise between an effective number of topics and our coherence scores.
Figure 9 Model Diagnostic Plots for Ohio. These are the coherence plot (top) and PyLDA visualization (Bottom)
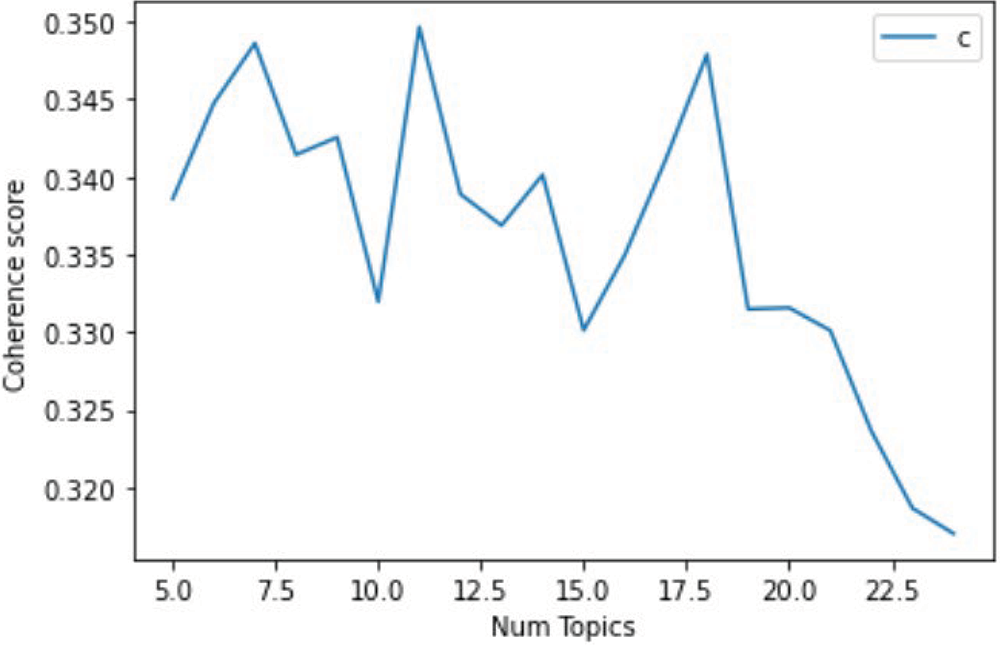
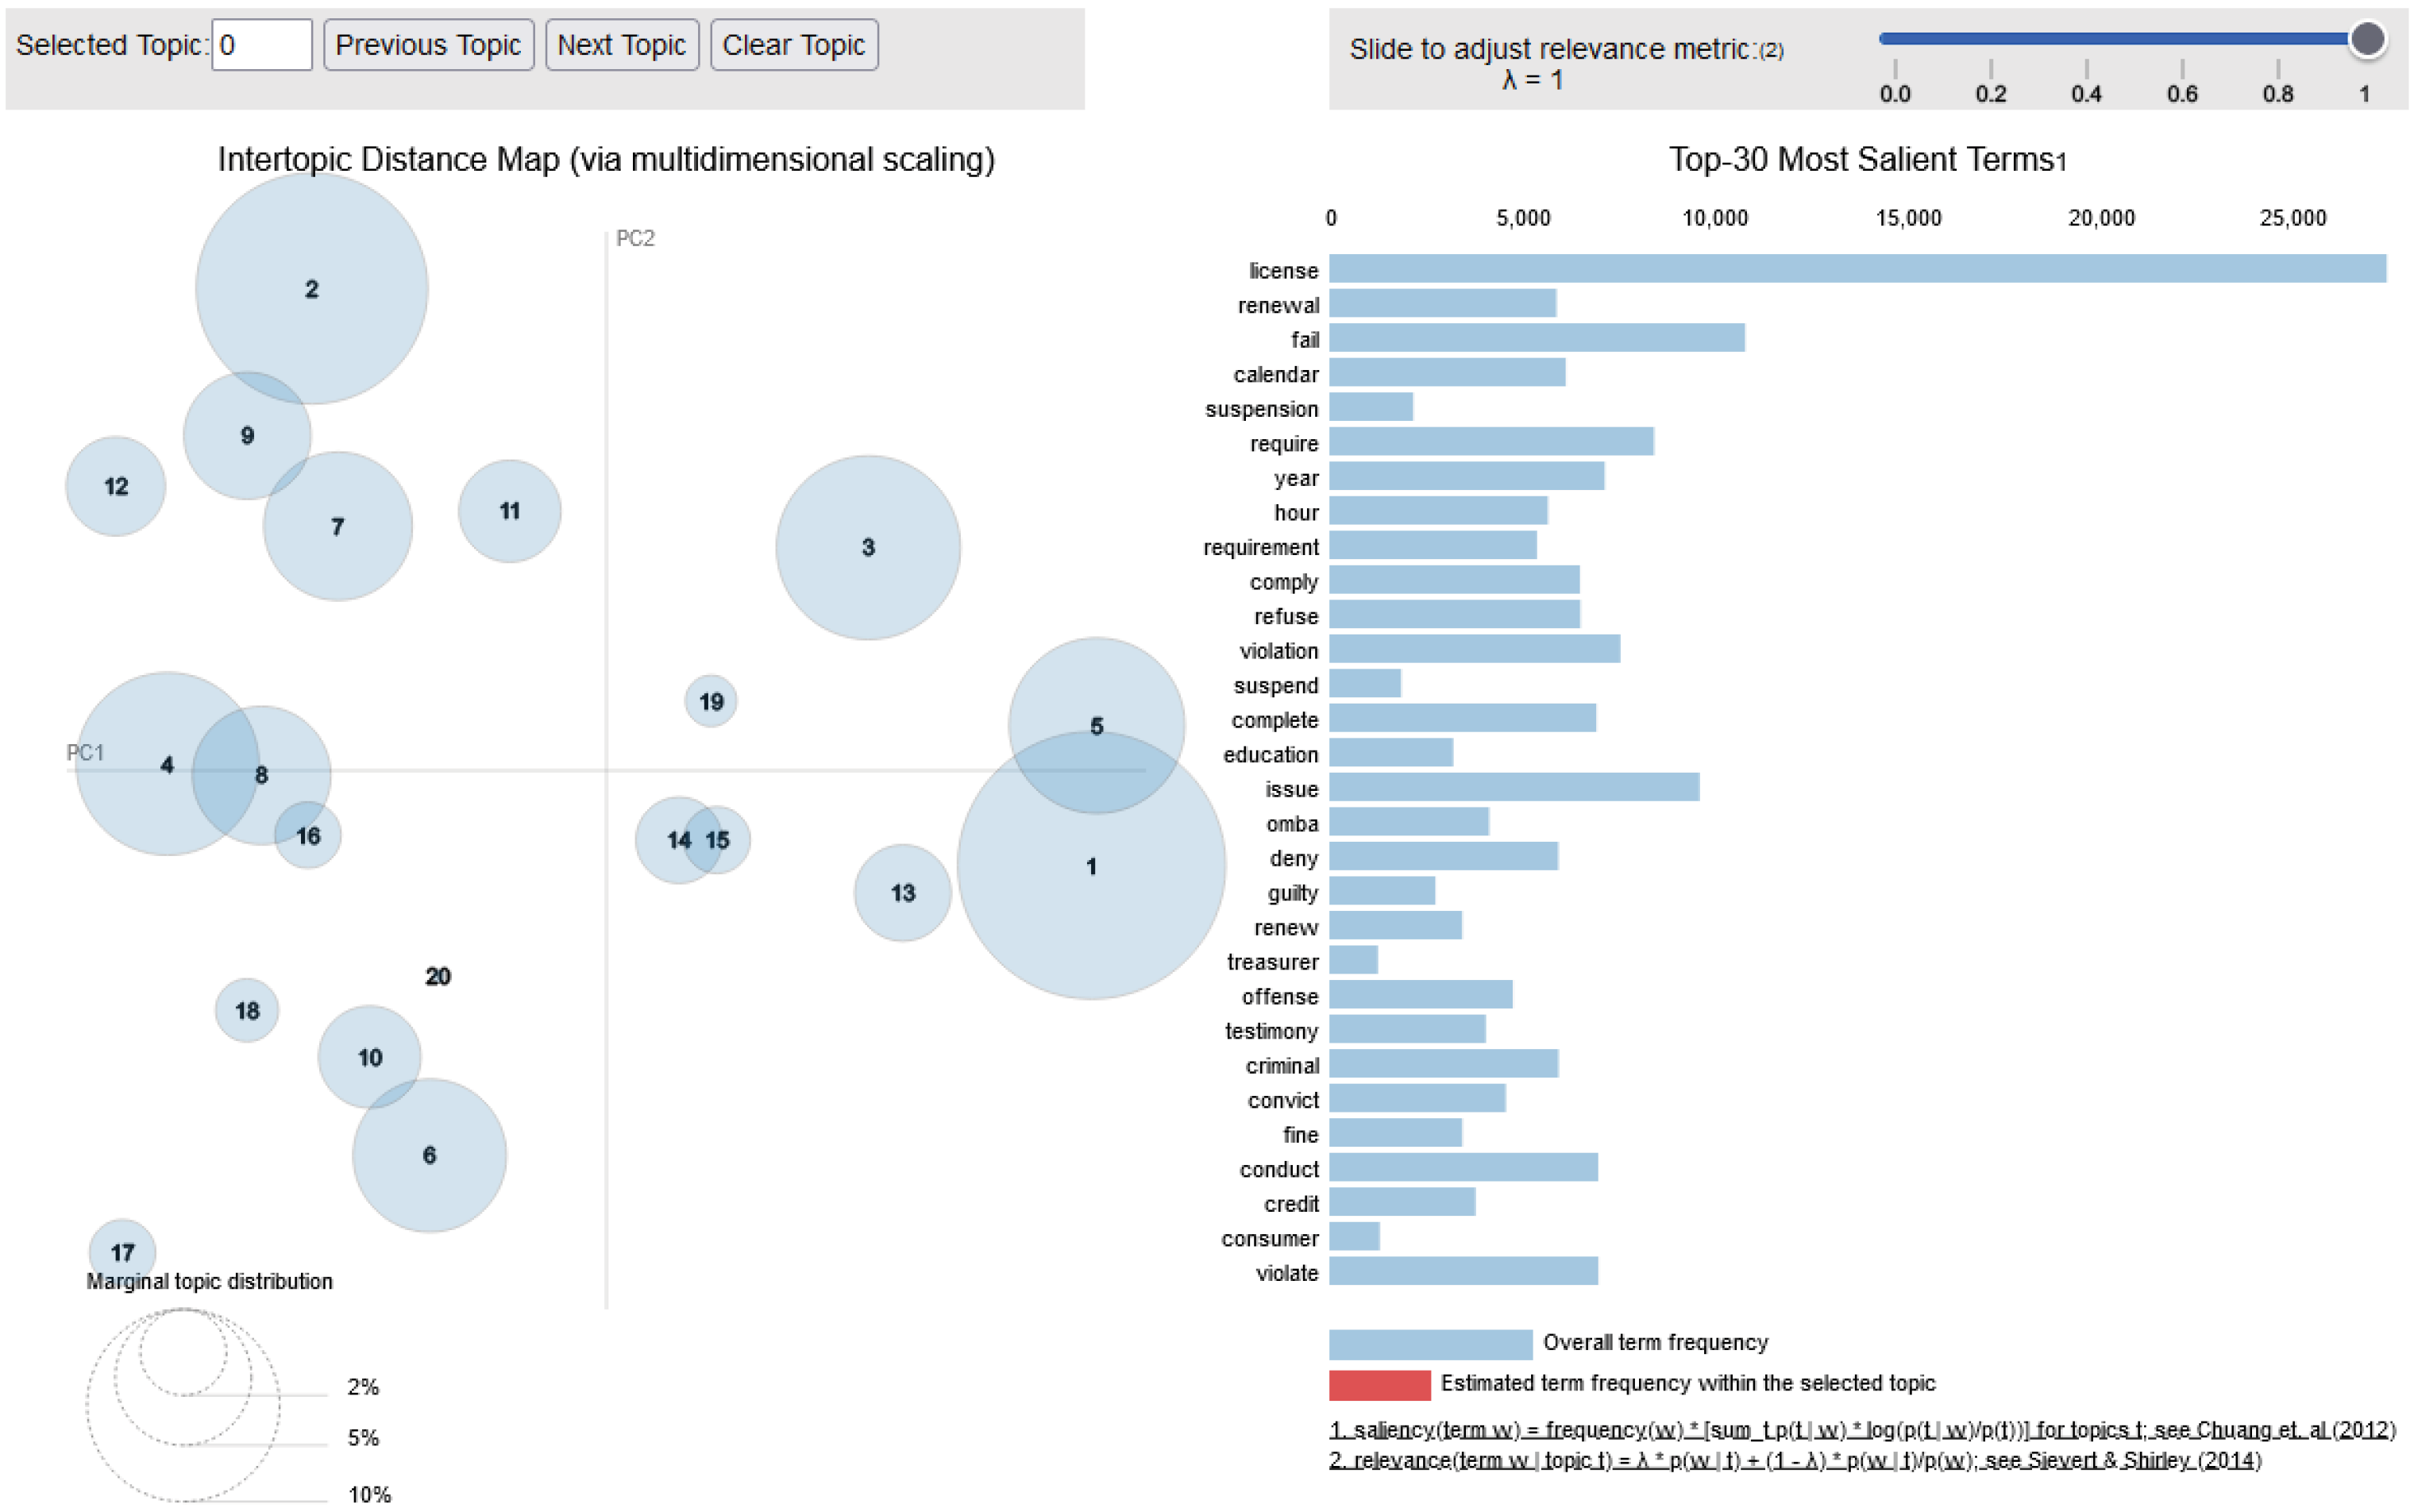
For Ohio, we chose 17 topics due to the spike at 0.3475 coherence score. Although there were higher coherence scores for 6 topics or less, we found through pyLDAvis that there were too few topics for us to be able to classify different types of offenses effectively and in a way that enabled analysis. This was a compromise between an effective number of topics and our coherence scores.
For our analysis of the state of Virginia, we used keyword marking due to the dataset containing a description of each infraction, as well as the law related to the MEA. Thus our analysis of the language was derived from R’s tidyverse package, and not from Quentada. As a result, we do not have model diagnostics as our text analysis came directly from Virginia’s State Corporation Commissions.
Figure 10 Model diagnostics to determine the appropriate number of topic models in Washington
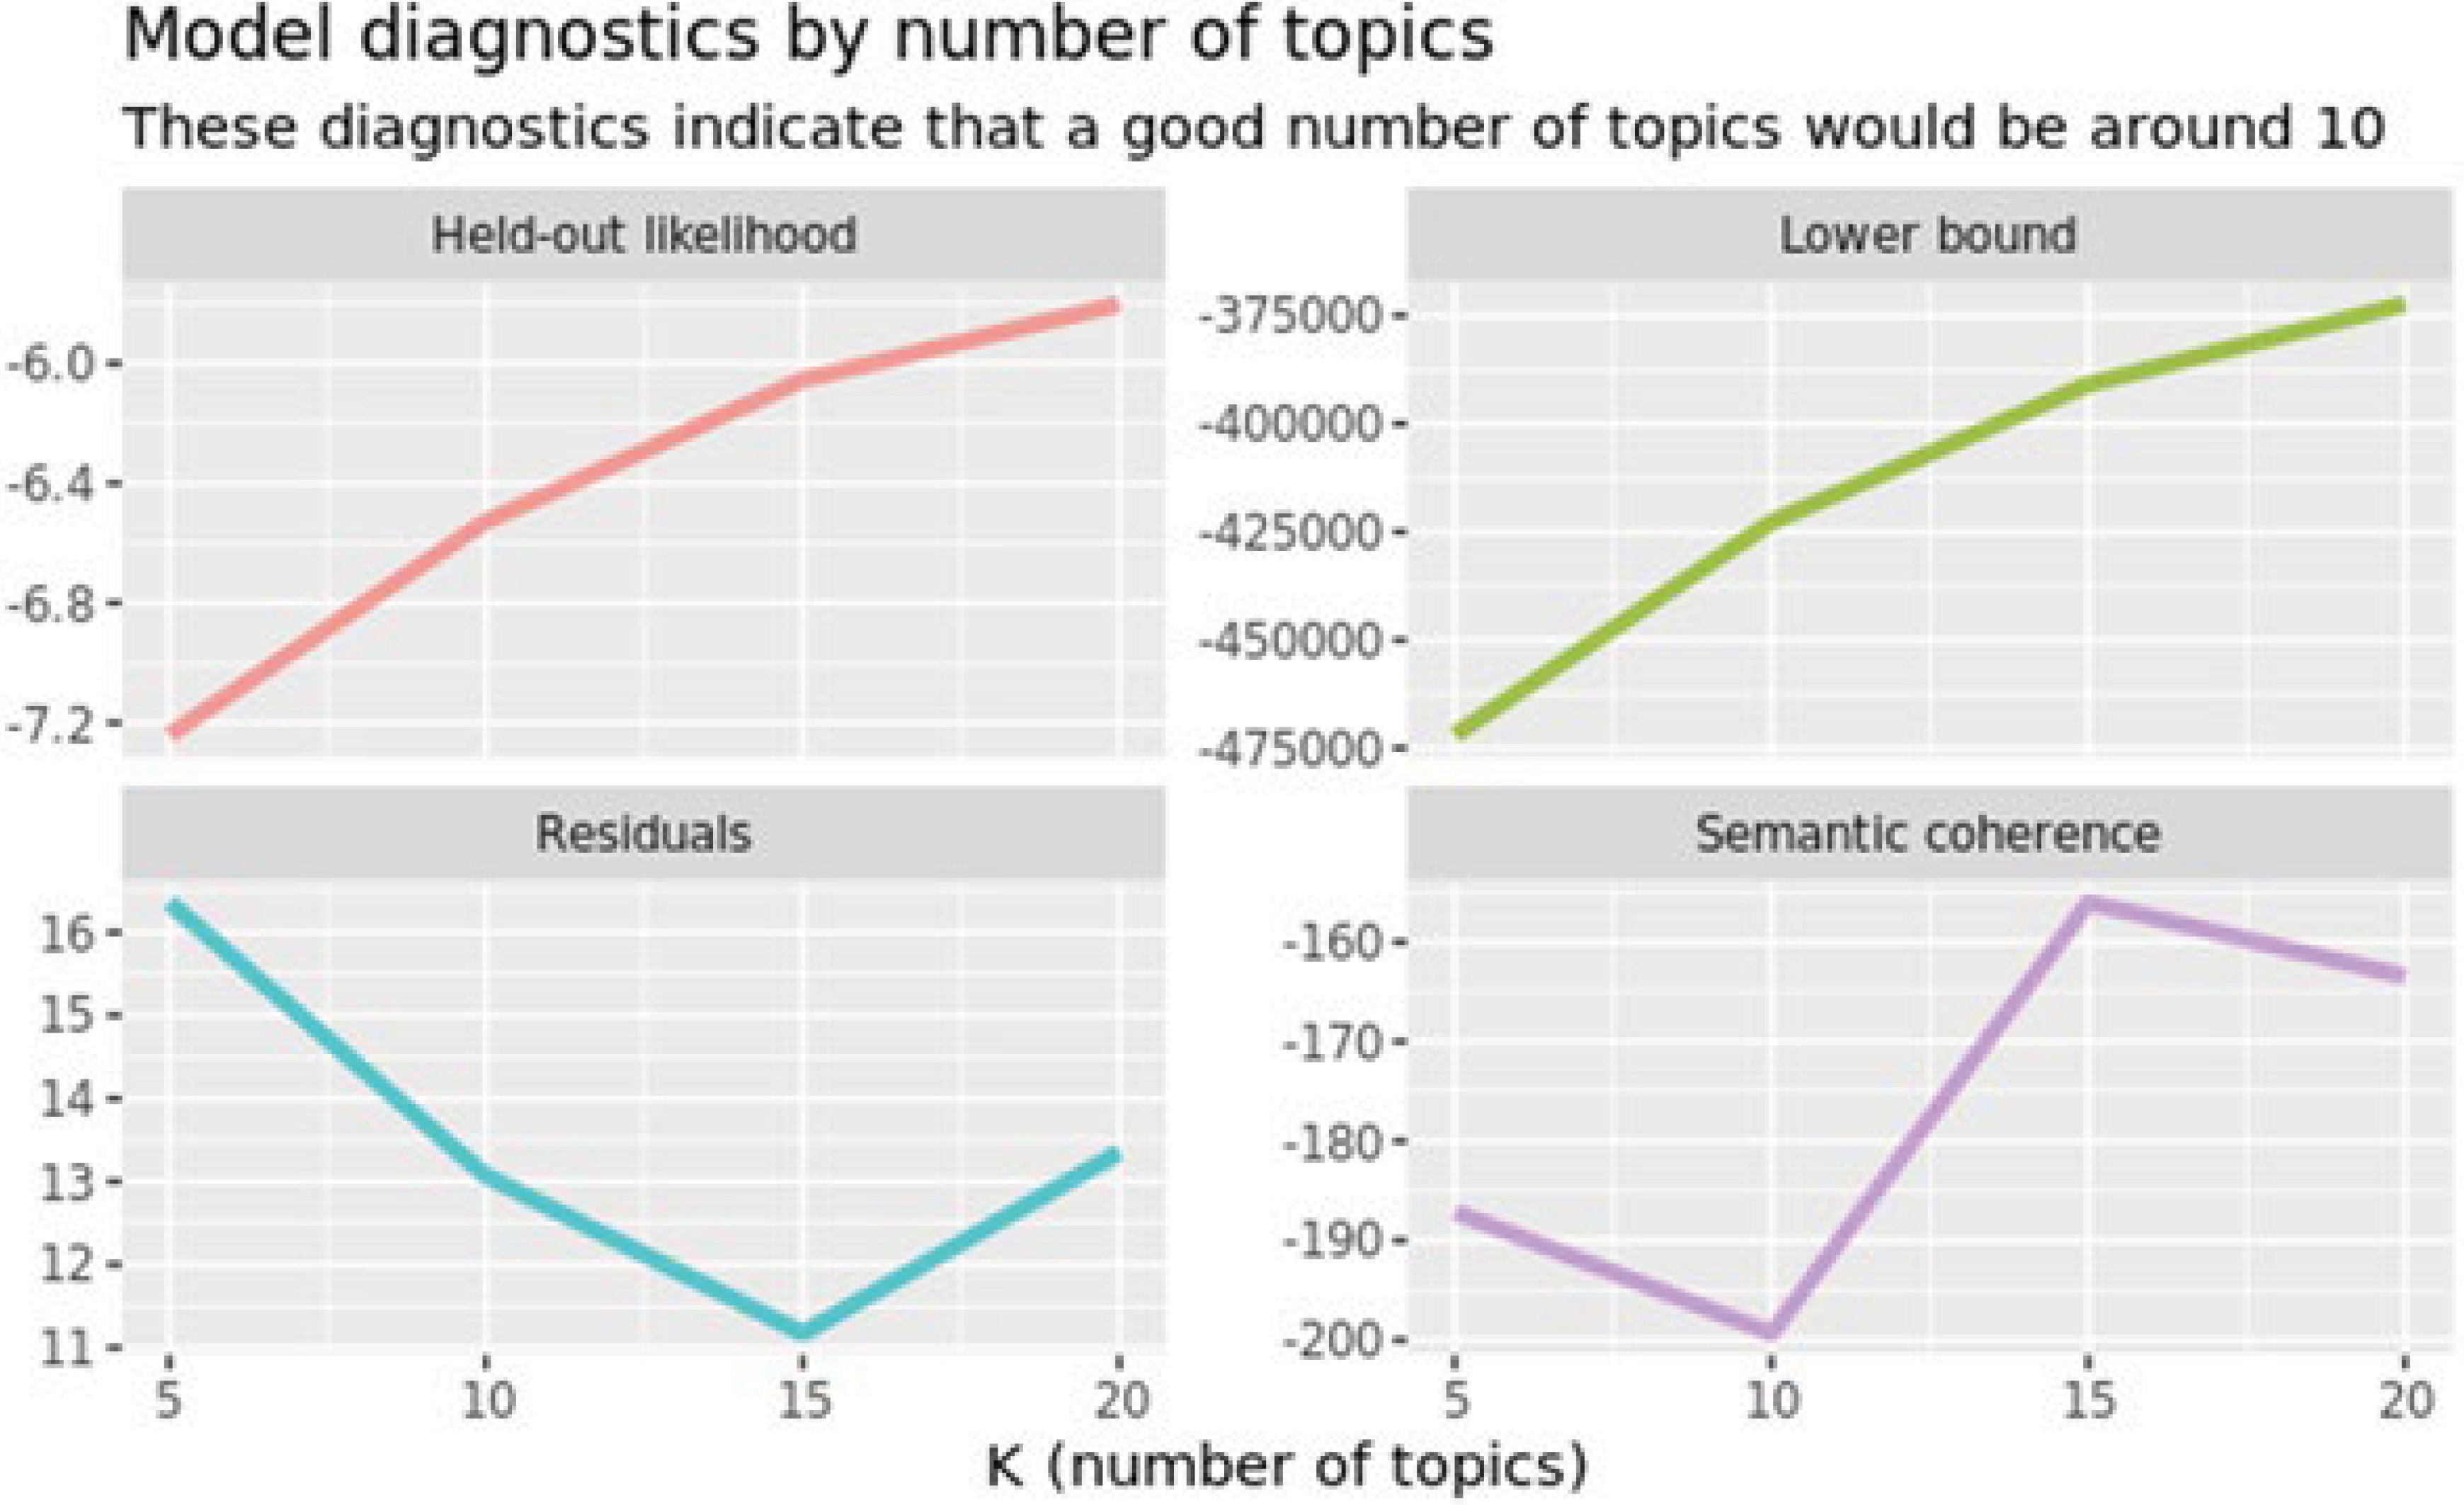
The graph above depicts the recommended number of topics for Washington MEAs. The held-out likelihood increases as the number of topics increases. The lower bound increases as the number of topics increases. The number of residuals decreases and then slightly increase for 20 topics. The semantic coherence decreases from 5 topics to 10 topics, and then increases for 15 topics and then slightly decreases. This graph indicates that the optimal number of topics is around 10.
[1] Tokenization signifies a process of breaking raw text into small chunks. Tokenization further breaks chunks of raw text into component elements, sometimes individual words, sometimes key phrases, and sometimes full sentences; the components are called tokens, which are key units of analysis in developing models for NLP. The tokenization helps in interpreting the meaning of the text by analyzing the sequence of the words.
[2] Lemmatization usually refers to doing things properly with the use of a vocabulary and morphological analysis of words, normally aiming to remove inflectional endings only and to return the base or dictionary form of a word, which is known as the lemma.
[3] https://blog.koheiw.net/?p=468