While the Rural Outer Coastal region is the least populous of our five regional groupings, it has still proven to be a very interesting area to study for a variety of reasons. First, it experienced the most dramatic housing bubble when compared to the other regions, as demonstrated by the following graph comparing annual House Price Index (HPI) among all counties by regional grouping.

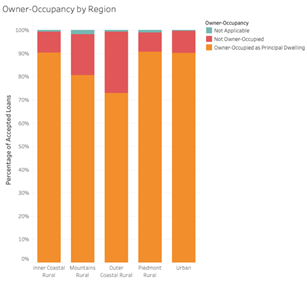
We believe several unique factors drove the housing bubble in the Outer Coastal region, the primary one being a strong presence of wealthy vacation-homeowners. As can be seen in the bar chart on the right, when looking at non-piggyback home purchase loans between 2000-2009, the Outer Coastal region has a far larger share of purchases that are not owner-occupied relative to the other regions. This is a direct reflection of the booming vacation home segment in these coastal, beachfront counties.
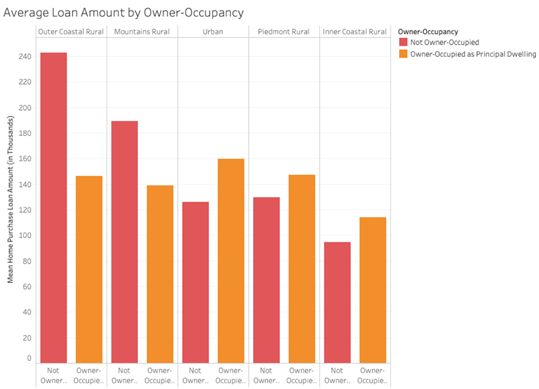
Furthermore, in the following graph we can observe the average loan amount for home purchases of properties that are classified as the owner’s principal dwelling versus properties that are not owner-occupied (encompassing the vacation home segment of the market). The presence of a huge market for wealthy vacation-homeowners can be easily observed as the average loan amount for non-owner-occupied home purchases in the Outer Coastal region far exceeds the average for home purchases for principal dwellings. This highlights the socioeconomic discrepancy between the more local populations in these counties and the vacation-homeowners who are far more affluent.
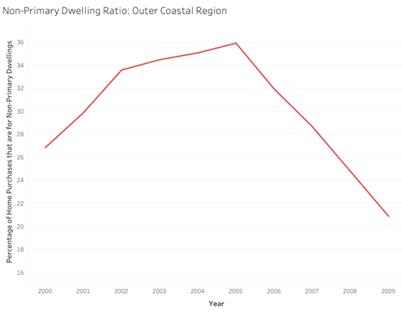
The following graph allows us to loosely track the popularity of vacation home purchases from 2000-2009 by showing the percentage of home purchases that are made on homes that are not the owner’s primary dwelling. The vacation home market appears to have peaked in 2005 and fell going into the crisis and its aftermath. This early drop in demand for beachfront vacation homes in 2006 could help explain why the annual HPI peaked in 2007 for the Outer Coastal region while it peaked in 2008 for all other regions in North Carolina.
The presence of wealthy vacation homeowners has a strong impact on the socioeconomic makeup and housing markets in coastal counties. The below graph plots mean HPI from Federal Reserve data vs the median applicant income from HMDA data which allows us to loosely observe the cost of living in the Outer Coastal region’s counties relative to the rest of the state’s counties. On average, the counties in the Outer Costal region appear to have a high cost of living relative to counties in other regions. However, one key thing to note is that the size of each dot represents the standard deviation in income for the county. Many counties in the Outer Coastal region have fairly large standard deviations in income (especially the outliers like Dare and Currituck county), showcasing the inequality between the wealthy vacation-homeowners and the local populace.

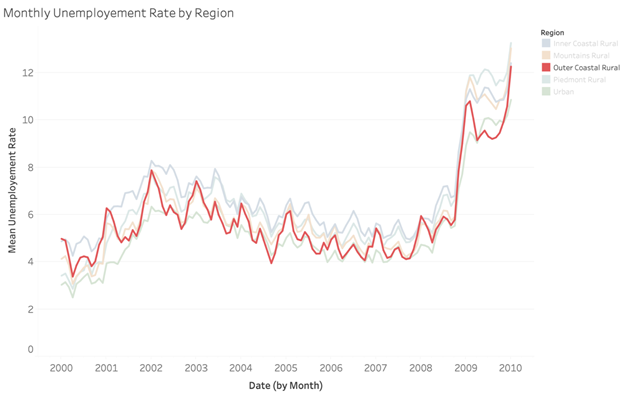
Another key characteristic of the Outer Coastal region is a strong reliance on tourism. Combined with the importance of fishing to the local economy, this results in counties having highly seasonal economies. This trend can be observed in the following chart, which plots population-weighted monthly unemployment data in the Outer Coastal region relative to the state’s other regions. When looking at county level data, many counties experience incredibly dramatic upswings in unemployment during the colder winter months, with all counties experiencing some form of seasonal fluctuation tied to their economic reliance on tourism and fishing.

The above table explores potential racial targeting in the Outer Coastal region’s home mortgage market. Even when controlling for income percentile and risk group, Black borrowers receive worse rate spreads than their White counterparts. It is important to note that many of these statistics should be taken with a grain of salt given that there aren’t many Black or Hispanic datapoints for certain groups (specifically the higher income to loan ratio and wealthier groups). This problem is bigger for the Outer Coastal region than for other regions because it is the least populous region in addition to being fairly homogenous with a population that is 73% white.
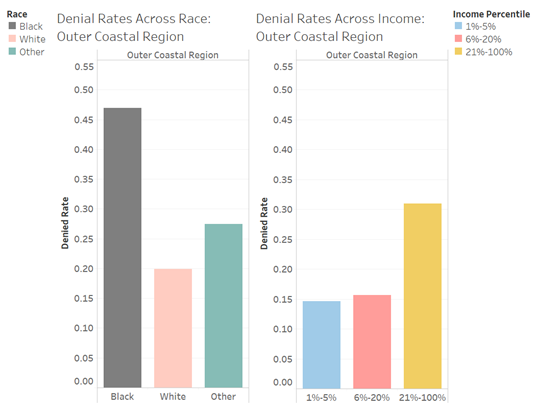
The following plot shows a comparison of loan denial rates in the Outer Coastal region by race and by income level. The denial rates were calculated as the total number of denied applicants divided by the total number of accepted applicants and denied applicants, excluding applications that were closed or withdrawn for whatever reason. When broken down by race, the Black applicants’ denial rates were the highest (46.90%) and more than double the Whites. Predictably, when comparing borrowers across income level, low-income applicants were more frequently denied (30.92%) than high-income applicants. This makes sense given that income largely determines a borrower’s capacity to pay.
When looking at originated, non-piggyback loans and further diving into property type by race, in the Outer Coastal region, applications for purchasing one-to-four family properties dominated the percentage of applicants across all race. Although lending institutions reported the property type as one-to-four family dwelling, multifamily dwelling, or manufactured and mobile homes, only less than 0.03% of all loans in each race were identified as multifamily housing so that it wasn’t shown in the following chart. According to our research, one of the reasons that the share of multifamily was relatively low may due to the fact that such property type was often misreported due to a lack of understanding under the HMDA old rules (pre-2018). The chart also shows that compared to their White and “Other” counterparts, more Black applicants (9.29%) applied for loans to purchase manufactured housing, which normally involve relatively high credit risk, in part because the buyers of such homes tend to have weaker financial profiles than do those buying other single or multi-family properties.

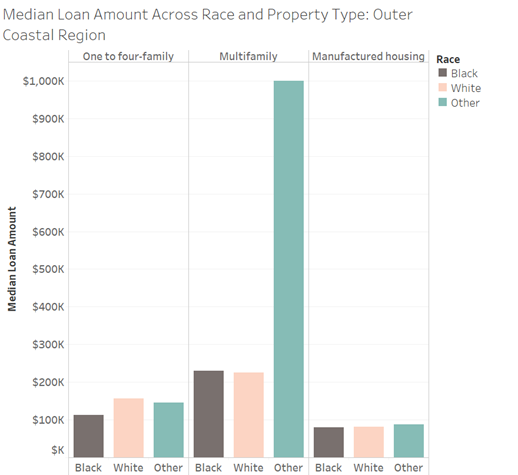
The following chart shows the median mortgage amount by race when looking at different property types. For loans to purchase one-to-four family properties, the White applicants received the highest loan amount and the Black applicants had the lowest loan amount. There is little difference in the loan amount that Black, White, and “Other” applicants received on manufactured housing. One interesting thing here is that for originated, non-piggyback loans among buyers of multifamily homes, there was only one “Other” applicant in Outer Coastal region, whose reported mortgage was one million dollars.
According to the HMDA rules, lending institutions are required to report the loan purpose that whether the loan is a Home Purchase, Refinancing or Home Improvement. The following two plots indicate that the most frequently reported loan purpose for one-to-four family properties was refinancing (48.24%), but the median loan amount for home purchases was higher than it was for refinancing. When looking at multifamily loans, the most commonly cited loan purpose was home purchase (49.3%), followed by refinancing (40.47%) and home improvement (10.23%). However, the value of the median home improvement loan exceeds that of refinancing, which indicates the cost of home remodels and renovations for multifamily properties in the Outer Coastal region is large. Furthermore, most manufactured housing loans was for home purchase (62.46%).

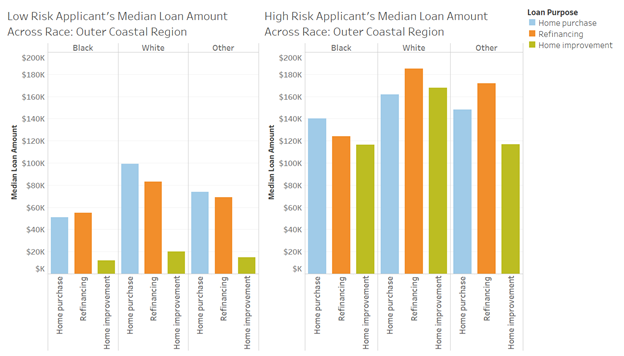
We also compared the low-risk and high-risk applicants’ mortgage purpose across race in the region. Here the risk was calculated as the applicant’s annual income divided by the loan amount. Therefore, if wealthy borrowers took out large loans relative to their income, they would be identified as high-risk applicants. The following two plots show that low-risk applicants of all races applied for smaller loan amounts than their high-risk counterparts, no matter the loan purpose. Furthermore, refinancing loans among Black, low-risk, applicants had a higher dollar amount than home purchase loans. This situation was opposite among White and “Other” low-risk applicants. Finally, among all loans for high-risk applicants, the highest loan amounts were for white applicants’ refinancing loans (more than $180,000), followed by “Other” applicants’ refinancing loans (over $170,000).
