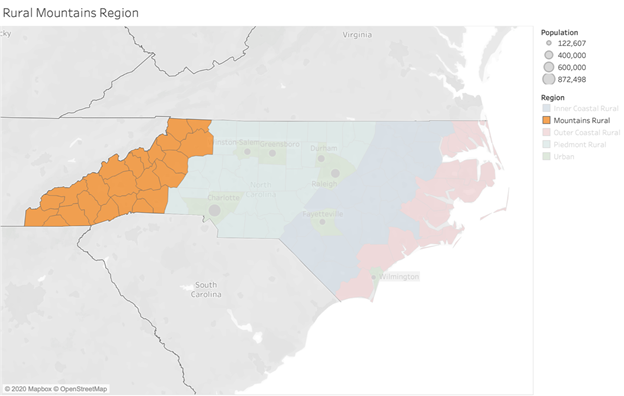
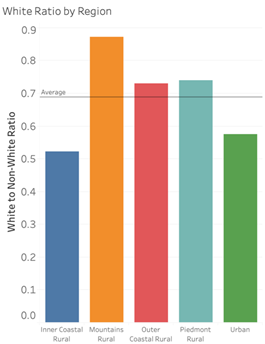
The Mountains region is unique, both geographically and culturally, in comparison to the other parts of North Carolina. One defining factor is the Mountains region’s biggest defining lack of racial/ethnic diversity. As can be seen in the graph on the right, the Mountains region’s ratio of white to non-white inhabitants is close to 90%. This changed the nature of our rate spread analysis to explore potential racial targeting as there were too few Black and Hispanic data points to segment our groups by both income and risk group. Even when only controlling for one, the Black and Hispanic populations still have few data points in certain segments (specifically the higher income brackets) so the analysis should be taken with a grain of salt.

One important characteristic of the Mountains region is that it experienced a larger housing bubble than other regions (excluding the Outer Coastal region). The above graph highlights this trend by plotting each county’s annual HPI grouped by region. The more dramatic housing bubble resulted in local economies in the Mountains region being hit hard in the aftermath of the 2008 crisis. This can be observed in the following graph which plots a county’s peak House Price Index (HPI) against the unemployment shock they experienced in the aftermath of the crisis (calculated as the difference between a county’s peak unemployment rate in the wake of the crisis and their mean unemployment rate from January 2000 to April 2008). Counties in the Mountains region clearly experienced high unemployment shock relative to counties in other regions. Furthermore, in the absence of county-level delinquency data, this graph can serve as a useful proxy for delinquency as it compares the impact of a county’s housing bubble and subsequent economic downturn.

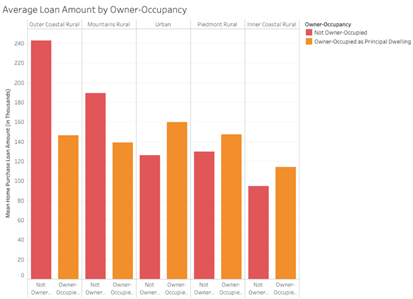
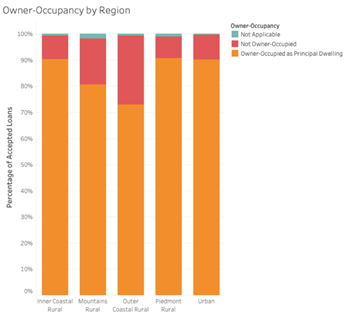
Similar to the Outer Coastal region, the housing market in the Mountains region is influenced by demand for high-priced vacation homes. The following bar chart on the left shows the breakdown off all non-piggyback home purchase loans between 2000-2009 by owner-occupancy status. The Mountains region clearly has a higher share of home purchases that are not owner-occupied than other regions (excluding the Outer Coastal region which also has a large vacation home market). The chart on the right compares the mean loan amount for the same grouping of loans, demonstrating how the vacation homes purchased in the Mountains region (which fall into the not owner-occupied grouping) are more expensive.
The graph on the right shows the prevalence of home purchases that are not owner-occupied from 2000-2009. It is interesting that this market peaks in 2006 while the Mountains region’s HPI peaked in 2008. Slack in demand for vacation homes in 2006 may have served as a precursor for events to come.

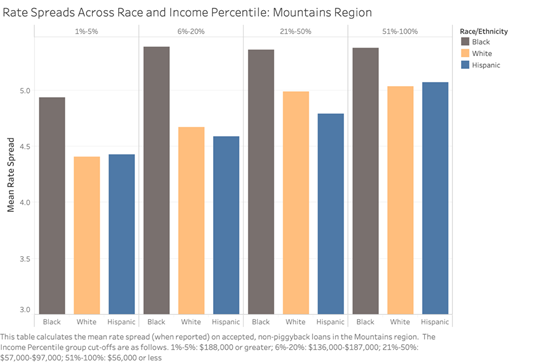
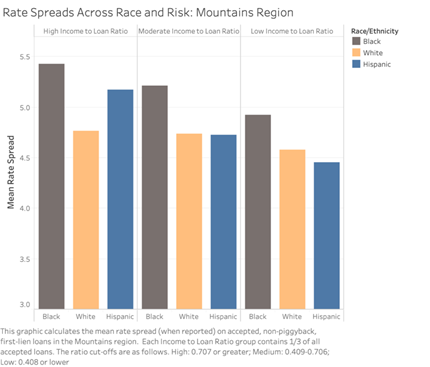
Due to the Mountains region’s lack of diversity, our analysis of potential racial targeting had to take a slightly different approach. We did not have enough data points for Black and Hispanic borrowers to segment our analysis by both income percentile and risk group, therefore we conducted these analyses separately in the following graphs. As can be observed, even when controlling for income or a loan’s riskiness (income to loan ratio was the best proxy available to us), Black borrowers receive far higher rates than their white counterparts. White and Hispanic borrowers tend to receive fairly similar rate spreads across the board.
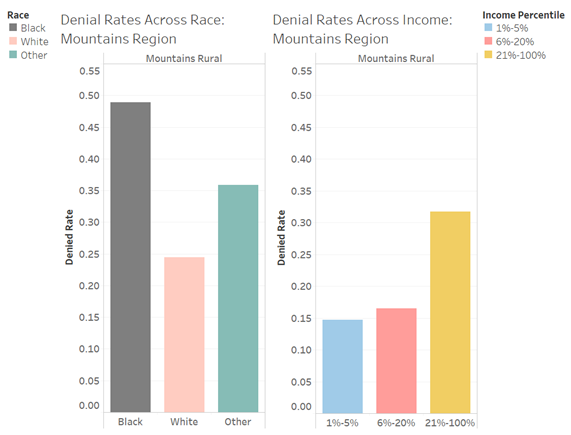
The mortgage application denial rate is often used as a measure of credit accessibility. The following plot shows a comparison of loan denial rates in the Mountains region by race and by income level. The denial rates were calculated as the total number of denied applicants divided by the total number of accepted applicants and denied applicants, excluding applications that were closed or withdrawn for different reasons. When broken down by race, the Black applicants’ denial rates were the highest (48.91%) and more than doubled the Whites (24.44%). However, since HMDA contains little information about the applicant’s credit characteristics, we do not know whether equally qualified applicants of varying backgrounds are being treated differently. On the other hand, when comparing borrowers across income level, low-income applicants were more frequently turned down (31.69%) by mortgage lenders while high-income applicants’ denial rates was the lowest (14.68%). This makes sense given that income largely determines a borrower’s capacity to pay.
Looking at accepted, non-piggyback loans and further diving into property type by race, in the Mountains region, applications for purchasing one-to-four family properties dominated the percentage of applicants across all race. Although lending institutions reported the property type as one-to-four family dwelling, multifamily dwelling, or manufactured and mobile homes, only less than 0.25% of all loans in each race were identified as multifamily housing so that it wasn’t shown in the following chart. According to our research, one of the reasons that the share of multifamily was relatively low may due to the fact that such property type was often misreported due to a lack of understanding under the HMDA old rules (pre-2018). The chart also shows that compared to their White counterparts, more Black applicants (9.04%) and “Other” applicants (8.78%) applied for loans to purchase manufactured housing, which normally involve relatively high credit risk, in part because the buyers of such homes tend to have weaker financial profiles than do those buying other single or multi-family properties.

The following chart shows the median mortgage amount by race when looking at different property types. For loans to purchase one-to-four family properties, the White applicants received the highest loan amount and the Black applicants had the lowest loan amount. There is little difference in the loan amount that Black, White, and “Other” applicants received on manufactured housing. Among buyers of multifamily homes, White applicants’ mortgages ($230,000) were larger than their Black counterparts’ ($158,500). Although only 5.45% of multifamily loans belonged to “Other” applicants, their average loan amount was the second highest among all types of loans ($218,000).

According to the HMDA rules, lending institutions are required to report the loan purpose that whether the loan is a Home Purchase, Refinancing or Home Improvement. The following left plot indicates that the most frequently reported loan purpose was refinancing for one-to-four family and multifamily, while home purchase was the top reason (54.89%) for manufactured housing. Few loans were reported to be for home improvements. When looking at the average loan amount across loan purpose, as shown in the right plot below, loans for multifamily were the largest. For one-to-four family loans, home purchase loans were of greater value than refinancing and home improvement loans; while for manufactured housing, the average size of refinancing loans were higher than home purchase and home improvement loans.

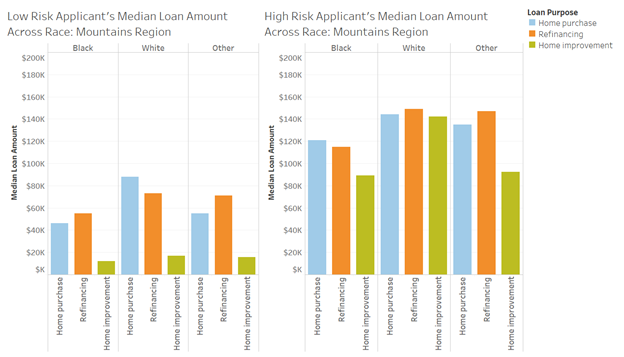
We also compared the low-risk and high-risk applicants’ mortgage purpose across race in the Mountains region. Here, the risk was calculated as the applicant’s annual income divided by the loan amount (income to loan ratio). The ratio cut-offs for the three risk groups are: 0.408 or lower for the low-risk applicants, 0.409-0.706 for the medium-risk applicants, and 0.707 or greater for the high-risk applicants. If wealthy borrowers took out large loans relative to their income, they would be identified as high-risk applicants. As can be seen in the following graphs, first, low-risk applicants of all races applied for lower value loans than their high-risk counterparts no matter the loan purpose or race. Second, low-risk applicants’ loans used for home improvement were quite small (no more than $17,000), but such loans among high-risk borrowers were as high as $142,000 for White borrowers. Third, refinancing loans among Black low-risk applicants were larger than home purchase loans while this situation was the opposite for Black high-risk applicants. On the other hand, refinancing loans among White low-risk applicants were of lower value than other loans, while such loans were the largest amount among the three purposes for White high-risk applicants. Finally, among all the loans from high-risk applicants, the largest loans came from the White applicants’ refinancing loans ($149,000), followed by “Other” applicants’ refinancing loans ($147,000).
