by William Zhao, Arjun Bakshi
In this report, we list seven key findings from our exploration of the mortgage market between 2000 and 2009 in Ohio. Although Ohio was relatively less affected by the housing bubble, our analysis points towards the existence of predatory behavior by mortgage lenders leading up to the crisis in Ohio.
Finding 1: Real home prices rose mildly in Ohio from 1991 to 2005. Home prices and the homeownership rate started to decrease in 2005.
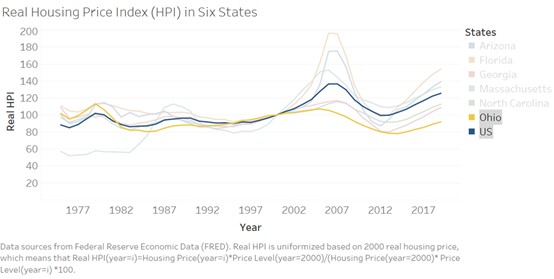
Home prices in Ohio followed a different trajectory than other states in our sample. Figure 1 shows that prices in Ohio started to rise in 1991; in other states we sampled, prices began their ascent around 1995. Between 1991 and 2005, Ohio home prices rose by 30%, which was a far milder increase than what many other states experienced. And unlike other states, price increases in Ohio did not accelerate in the early 2000s. The precise reasons for Ohio’s tepid pre-crisis housing market are beyond the scope of our analysis, but several factors were likely at play. First, Ohio had a more robust regulatory response to abuses in the mortgage lending market compared to many other states[1]. And second, Ohio’s economy was not performing as well as many other states during this period because of the secular decline in manufacturing in the U.S.
Ohio was not immune when the housing bubble burst nationwide. Home prices bottomed out in 2012 after falling 30% from their pre-crisis high. Much like the ascent, the severity and length of the decline in home prices was less dramatic when compared to other states.
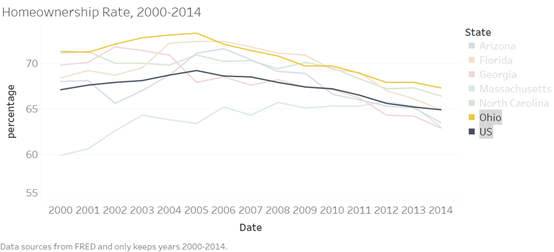
Figure 2 shows that the homeownership rate in Ohio reached its peak of 75% in 2005, which was a year or two before most other states saw their homeownership rate peak. When the bubble burst, the homeownership rate fell to 68% in 2014. It is worth noting that for most of the pre and post-crisis period, Ohio’s ownership rate exceeded the rate in many other states.
Finding 2: The ratio of refinancing loans peaked and the denial rate reached its lowest point in 2003.
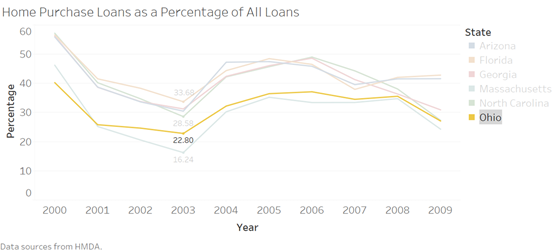
As shown in Figure 3, the ratio of refinancing loans increased in the early 2000s before peaking in 2003 at 70%. Afterwards, the refinancing ratio steadily dropped, eventually settling around 45% until 2008. The decline in the refinancing ratio, and corresponding increase in purchase loans, is most likely due to the Federal Reserve raising interest rates beginning in May 2004. Compared to other states in our sample, the refinancing ratio in Ohio was high. This may point toward the prevalence of predatory lenders who were more active in the refinancing market than the purchase loan market.
The denial rate also reached its lowest point in 2003 at 17% (Figure 4) most likely due to the Federal Reserve’s interest rate increases, which made mortgages more expensive for borrowers. Ohio’s denial rate was also higher than other states in our sample, which may be reflective of tighter underwriting standards in the state or simply a dearth of qualified borrowers. The high denial rate certainly was a factor in restricting the growth in Ohio home prices pre-crisis and softening the blow once the bubble burst.


Finding 3: Investor property loans and loans issued to minorities accounted for a relatively small share of mortgage loans in Ohio.
Figure 6 shows that the percentage of investor property loans accounted for only 5% to 10% of loans in Ohio from 2000 to 2009, compared to 10%-20% in many other states. Investor property loans saw a mild increase in 2004 from 6% to 9%, most likely reflecting the euphoria and house-flipping activity that was prevalent nationwide leading up to the crisis.
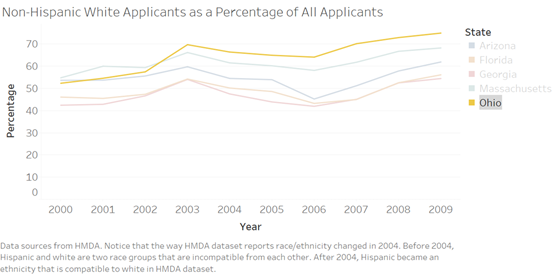
Because of the relatively lower percentage of minorities in Ohio (80% of the state’s population is white), loans issued to minorities accounted for a lower percentage of total loans when compared to other states. Figure 7 shows that loans issued to non-Hispanic white applicants accounted for more than 70% of total loans in Ohio. This means that percentage of loans issued to minorities in Ohio (below 30%) was less than the 50% average in the other states we sampled. Because predatory lenders disproportionately targeted minority partners, these lenders may have been less active in Ohio. However, the percentage of loans issued to minorities did increase by roughly 5% between 2003 and 2006 with no clear explanation as to why. It may be that the booming nationwide housing market led lenders to lower underwriting standards during this time, which expanded access to credit for many minority borrowers.

Finding 4: There is a contradiction between loan amounts and applicant income.
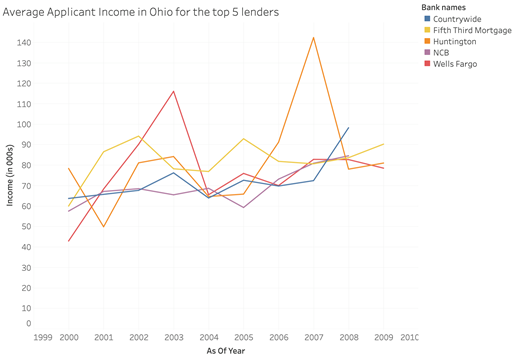
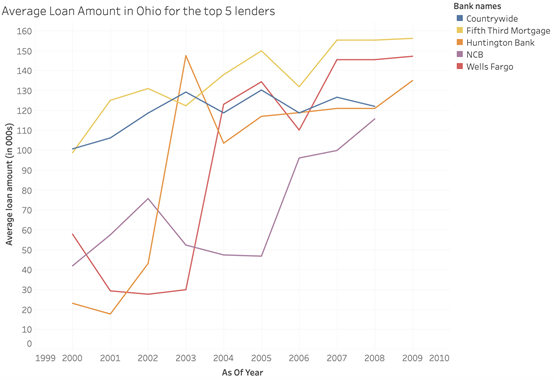
Similar to other states, there was a contradiction between average applicant income and loan amounts within the top 5 mortgage lenders in Ohio. These 5 lenders were determined by using the “respondent_id” numbers in the HMDA data set. After filtering the HMDA data set by state code (39 for Ohio) and for the time period (2000-2009), we sorted the data by the frequency of respondent_id. We then matched a respondent_id with a financial institution using the HMDA website.
As seen in Figures 8 and 9, there was an erratic rise in both average applicant income and loan amounts in Ohio. For example, applicant incomes spiked for both Wells Fargo (2003) and Huntington Bank (2007) as did the average loan amount. However, the dates at which both variables moved are not perfectly aligned and for the other lenders, there appears to be no relationship between the two variables. We observed similar dynamics in the other states we analyzed.
Finding 5: There was a sharp drop off in conventional loans being issued.
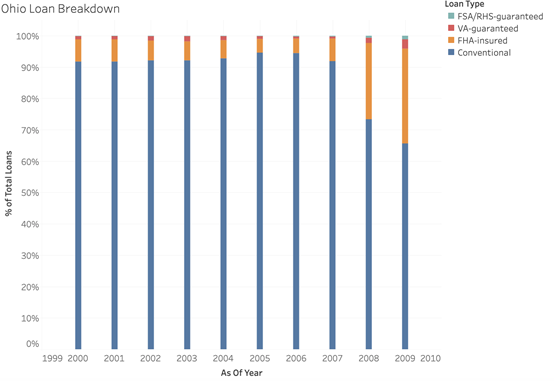
There was noticeable drop-off in the amount of conventional loans issued once the crisis hit in Ohio. As seen in Figure 10, at the peak of the housing bubble, 94.39% of mortgages issued in Ohio were classified as conventional, meaning they were not offered or secured by a government entity. In contrast, by 2009, conventional loans constituted just 65.6% of all loans issued in Ohio. The decline in conventional loans was filled by FHA-insured loans. The Federal Housing Administration, insures loans with the purpose of providing low-to-moderate income borrowers access to mortgage credit. These borrowers tend to have lower credit scores and difficulty in affording the standard 20% down payment for conventional loans. With unemployment spiking to 10.9% in Ohio once the bubble burst, it is no surprise that borrowers looked to the FHA for mortgage credit.
HMDA (Home Mortgage Disclosure Act) data set is a publicly available data set that documents loan data since 1975. In this summary, we use the 2000-2009 HMDA data to generate visualizations that are helpful to the understanding of American predatory lending. After getting the data for each state in each year, a sampling is conducted to contract the size of data so that our laptops can easily carry it. For data of each of the five states in each of the ten years, we randomly select 8,000 rows that represent 8,000 loans. These segments sum up to 80,000 loans for each state over the 10 years period.
[1] Richard Cordray, “Oral History,” interviewed by Sean Nguyen, April 8th, 2020, audio and transcript available at apl.reclaim.hosting/oral-histories-2/richard-cordray-former-director-of-the-cfpb-and-ohio-attorney-general/