by Arjun Bakshi
The topic of this independent study is to examine the North Carolina housing market from 2007 to 2017. The 2008 financial crisis severely impacted many households around the country, including North Carolina. In the early 2000s, a large housing bubble emerged across the US – house prices appreciation occurred rapidly and more people took out high-APR mortgages on properties that previously they would have never considered. Due to a culmination of reasons that we will not be exploring in this report, the supposed “never-ending” appreciation did indeed come to a halt in 2007. Thus began a wave of unemployment, foreclosures, and a decrease in homeownership. The loosening lending standards and the low-interest rate climate together drove the irrational behavior in the market, which ultimately resulted in what we call the “Great Recession”.
This report will be examining the housing market in North Carolina. Lots of research has already been conducted on the US and global financial crisis, but little literature exists on how the Tar Heel State fared during this severe economic climate. More specifically, this report will be looking at the time frame from 2007 to 2017, therefore analyzing more closely the beginning of the recession until a decade later. Researching this period will provide a clear and precise summary of how the North Carolina housing market has been able to emerge from 2007. The analysis will be looking at the state-wide recovery, as well as taking 2 specific counties to use a comparison of how different parts of the state had different characteristics to their recovery.
Data collection and cleaning
The data that this report has used largely is sourced from the Home Mortgage Disclosure Act. This is all hosted on the Consumer Financial Protection Bureau website. Each year thousands of financial institutions report data about mortgages to the public, under the Home Mortgage Disclosure Act (HMDA), and are available for download. The total dataset (2007-2017) was initially 5,936,598 data points, each data point representing a unique mortgage. This averaged out to 470,000 entries for each year. The dataset contains 78 columns including categories such as “loan amount”, “applicant income”, “race”, “gender”, “denial reason”, “rate spread”, amongst others.
Given the level of software available, it would not have been possible to conduct the data analysis portion of this report with nearly 6 million entries. I used a data sampling strategy previously used in a Data+ Project – for each year, I took a random sample of 10,000 data entries on Microsoft Excel, generating a CSV file with 110,000 points. The data file represented a random sample that was 1.8% of the total data set.
Once the initial data collection process was completed, I imported this dataset into RStudio, a software program that is specifically geared for statistical analysis and visualization production. Using R, I was able to generate the data for the visualizations that are featured below in the report.
The existence of a housing bubble in North Carolina
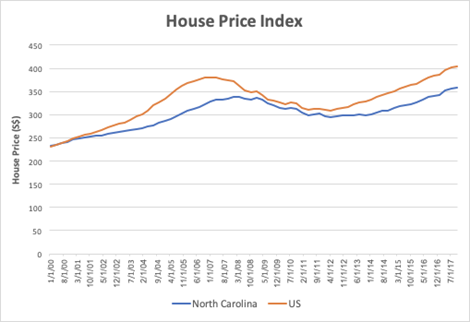
The first two visualizations shown here exhibit the wider, more generalized view of the North Carolina housing market, using the entire US market as a comparison. As we can see, the two metrics used for this portion of the analysis are the homeownership rate, as well as the House Price Index (HPI). These two metrics provide a view of what house prices were like, and how these fluctuating house prices were affecting the number of mortgages being originated.
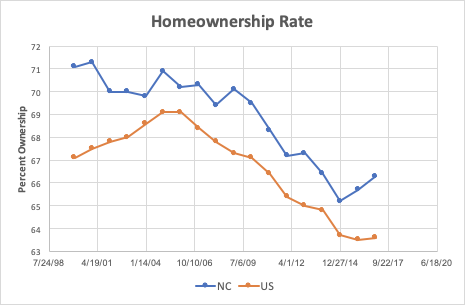
As seen in the first visualization, North Carolina consistently had a higher homeownership rate compared to the US. At its peak in 2008, NC’s rate was 3.4% higher than in the US. Another interesting note is that North Carolina’s homeownership rate peaked much earlier than the US, and began its process of a gradual decrease 5 years prior. The US homeownership rate peaked in 2005 at 69.1% – this can be largely credited to the differences in housing legislation introduced nationwide versus North Carolina. In the 15 years between 1974 and 1989, the United States introduced 6 pieces of legislation that fundamentally altered the housing market, providing more structure and regulation to the industry and ensuring that homeowners had more support. This included the famous 1977 Community Reinvestment Act, which provided more opportunities for low-income neighborhoods to have access to lending institutions for mortgage origination. Between 1989 and the onset of the crisis in 2007 (18 years), the United States government only passed 1 significant piece of housing legislation – the Home Ownership and Equity Protection Act. Comparatively, North Carolina passed 4 individual pieces of housing legislation from 1999 to 2001, including the extremely influential North Carolina Predatory Lending Law which provided protections to all mortgages, outlawed prepayment penalties on mortgages, and lending without the consideration of a borrower’s ability to repay – an act of lending that became notorious nationwide during the housing bubble expansion. The activity of the NC legislative branch compared to the inactivity of federal legislation on the housing market helps us understand why the North Carolina homeownership rate peaked earlier, as more stringent legislation was imposed more consistently after the turn of the 21st century.
What is perhaps more interesting is the actions North Carolina took after 2007. Average house prices fell from $337,000 to $294,000 (2007 to 2012). This decrease of 12.5% is roughly in-line with what other states saw – however, what makes North Carolina different is that their lowest recorded HPI ($294,000) was in 2012. Compared to the US, and other states such as Arizona and Florida, this is significantly later and shows a prolonged “hangover effect” that the financial crisis had on the state. This is further evidenced by the fact that homeownership rates continued at the same rate of decrease from 2009 to 2012, with no significant slowdown.
Overall the data and legislation combined point towards a messy picture, in which North Carolina imposed strong legislation on the housing market earlier than most states, but still on face-value suffered almost to the same extent as the whole country.
Finding 1: Tighter lending regulations in North Carolina
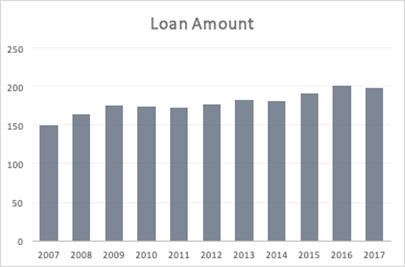
One phenomenon of great interest is the relationship between loan amount and applicant income. In previous research conducted from the years 2000 to 2007, the general trend in the US showed an aggressive increase in the average loan amount whilst applicant incomes remained at a similar level. This intuitively makes sense – big lending institutions such as Countrywide Loans repeatedly originated subprime mortgages that defaulted as soon as negative economic conditions arrived in 2007.
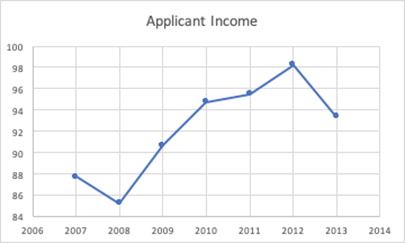
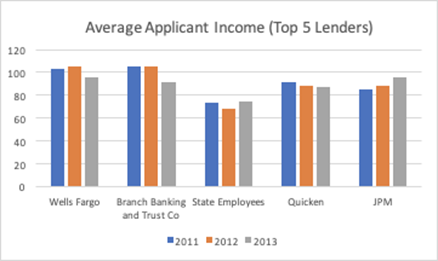
One caveat to this data is that the HMDA data set has numerous irregularities. For example, even though the applicant loan amount is recorded until 2017, the applicant income is only recorded until 2013. This is because there have been several changes to the way that HMDA collects data over the years that have caused these inconsistencies.
Before 2007, the average loan amount far outpaced the rate at which applicant incomes rose across the country. As previously mentioned, this can be explained by the behavior exhibited by some banks, particularly the likes of Wells Fargo and Countrywide in North Carolina, where mortgage applications were granted with ease and no background checks were administered. The rate at which loan amounts far outpaced applicant incomes pre-2007 perfectly demonstrated the shaky foundations on which the housing market was built.
However, as we can see in figure 3, loan amounts from 2007 to 2017 rose, but they rose at a far more measured pace. They increased from $149,000 to $198,000 in 2017, an increase of 32.8%. Unfortunately, the data for applicant income in North Carolina was only recorded until 2013, and even though 2013 showed a significant downturn in applicant income, we can confidently project that applicant income would have continued to rise and reach at least $100,000 by 2017. This would mean that the estimated increase in applicant income is 12%.
Thus one can see the impact regulations had on the lending market. No longer did average loan amounts outweigh applicant income by 10* or 20*, but now it was around 2.5*/3*. This helps to explain the decrease in delinquency rates across these years as well.
Total loan composition within North Carolina

Our initial analysis focuses on how the nature of mortgage loans changed from 2007 up to 2017 within North Carolina. The HMDA dataset categorizes loans into 4 different themes. These were conventional, FHA (Federal Housing Administration), VA (Veterans Affairs), and FSA/RHS programs. The main difference between all these programs is that conventional loans are not guaranteed by the US government, Fannie, Freddie, or Ginnie – i.e. it is not backed by a government agency. Unlike the other loan categories, conventional loans are originated by private mortgage lending institutions and do not provide as much protection.
The first observation is that in 2007, conventional loans made up 92.97% of all total loans originated in North Carolina. This is an extremely high number and points towards a reckless and unstable housing market in which the ease of accessing a conventional loan was too high. By the time national and state legislation was imposed and revised in 2007, the aftermath was seen by 2011 when conventional loans dropped to only 70.7% of all loans originated in the state.
The second major observation is the explosion of VA-guaranteed loans, starting in 2007 and continuing to expand until 2017. In 2007, VA loans only made up 2% of total loans. This has rapidly increased to 14% within a decade. This explosion of VA has been a targeted effort, coupled with the FHA in broadening the criteria for homeowners to satisfy receiving a VA loan and ensuring that a greater number of mortgages are better protected from delinquency.
Conventional loans composition within North Carolina
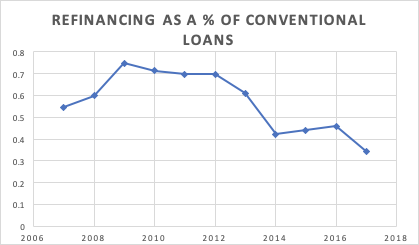
Perhaps one of the most interesting observations made possible through this dataset is the analysis of conventional loans in North Carolina. A conventional loan is any mortgage loan that is not insured or guaranteed by the government (such as under Federal Housing Administration, Department of Veterans Affairs, or Department of Agriculture loan programs). This naturally means that conventional loans can be deemed as less risk-averse than loans originated from the VA or FUD, as they are not backed by a government institution. Additionally, a refinanced loan refers to the process of revising and replacing the terms of an existing mortgage. Usually, this occurs when the homeowner effectively seeks to make favorable changes to their interest rate, payment schedule, and/or other terms outlined in their contract.
Before 2007, we witnessed a stark increase in refinancing as a percentage of conventional loans. The other possibilities recorded within the HMDA data set were home improvements and home purchases. By 2005, refinancing comprised over 70% of conventional loan usage in North Carolina. This points to a system in which mortgage owners held riskier mortgage terms, were not backed by government agencies, and even then, were still looking for improvements on these mortgages.
By 2009, 74% of conventional loans were being used for refinancing. However, it is interesting to note what we see from 2009 onwards regarding this specific trend. Refinancing dramatically decreased in its prevalence across America, as homeowners were no longer focused on maximizing their mortgages for the most favorable terms of condition, but rather were focused on fulfilling their mortgage obligations in the first place. By 2017, refinancing had dropped 54% in terms of its usage through conventional loans. On further analysis, we can see that the majority of this decrease in frequency occurred in the years 2012, 2013, and 2014. This is because business conditions have become less favorable for risky and high-volume refinancing. During these years, there were several new regulations imposed both on the state and national level, specifically designed to increase sustainable housing and reduce the delinquency rate. For example, in 2009 North Carolina introduced the Secure and Fair Enforcement (SAFE) Mortgage Licensing Act, an act that imposed stricter reporting fees and due diligence on mortgage businesses, as well as required background checks for all mortgage applications. Furthermore, another example of wider-scale legislation is that Congress enacted The Housing and Economic Recovery Act of 2008 (HERA) as one set of measures to address the subprime mortgage crisis in 2008. This measure included the Secure and Fair Enforcement for Mortgage Licensing Act of 2008 (SAFE Act) and the Federal Housing Administration (FHA) Modernization Act of 2008, both of which created greater regulations and increased the difficulty of accessing conventional loans for lower and middle-income households.
Finally, one interesting thing to note is that while North Carolina has seen a dramatic decrease in the prevalence of refinancing within the conventional loan market, this trend over the previous decade has certainly been reversed to some extent since the introduction of Covid-19. The pandemic, coupled with a booming house market, has meant that house prices within areas such as the Triangle have increased by over 12.5% in the past year. While post-pandemic data is unavailable, it will be interesting to note whether refinancing has dramatically increased in its usage since March 2020.
Financial institution mortgage activity
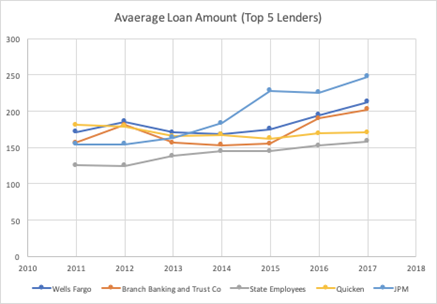
These two visualizations show the interaction between the average loan amount and applicant income for specific financial institutions within North Carolina. Once again, the HMDA data set provides a specific “respondent_id” tag that can be correlated with a company. Therefore each loan can be tied to a lending institution. After using aggregation techniques, the top 5 firms in North Carolina for originating mortgages were Wells Fargo, Branch Banking and Trust Co, State Employees, Quicken Loans, & JP Morgan. Similar to the previous visualization on average total applicant income, unfortunately, there is no applicant income data available after 2014. This makes the means for comparison more difficult, but the combination of both visualizations provides meaningful conclusions nonetheless.
Firstly, we can see that JP Morgan has been acting the most aggressively out of the top 5 firms since 2007. Before 2007, they were not one of the major lenders in the state, but are now firmly considered one. Their average loan amounts have increased by over 63% from 2007 to 2017. Interestingly enough, there is not a clear positive trend that all firms have increased their average loan amounts – for example, in 2007 the average Quicken loan was at $181,000, and by 2017, it was $170,000. Given the slow growth trend exhibited by several other firms, JP Morgan’s activity in North Carolina certainly is an outlier in their aggressive approach in increasing their average loan amount.
A second interesting observation is Branch Banking and Trust’s activity between 2015 and 2016. In 2015, their average loan amount was $155,000, whereas, in 2016, this jumped to $190,000. This increase of 22.5% in one year is certainly unprecedented and is something that was not observed by any other financial institution during this period. One possible explanation is that through the sampling process, a limited sample of Branch Banking and Trust data points were taken from the 2016 year, and those that were selected were exclusively in the upper bound of the average loan amount, thus manipulating the data to cause such a jump. This is one of the greatest limitations of having a sample size representing a much larger total dataset.
Specific demographic and geographic breakdown
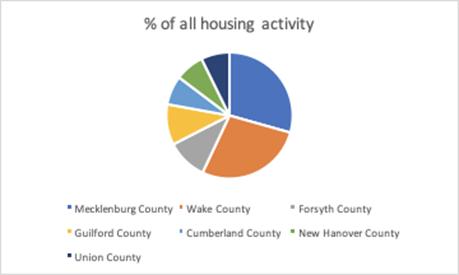
As a further breakdown into the data available through the HMDA dataset, the CSV files provide specific information about which county each loan originated in. Using this information, we were able to create a frequency table that ranked how prevalent loans were from all the counties within North Carolina. Unsurprisingly, Mecklenburg County ranks as the number 1 for loans originated, most likely due to Charlotte, the largest city in the state present in the county. Wake County, the second most frequent county, includes both Cary and Raleigh in the Triangle region. Forsyth County includes Winston-Salem and its surrounding areas. Therefore, to further the analysis of North Carolina, Mecklenburg County was specifically chosen to be used as a case study for how a county containing both metropolitan and agricultural districts would behave when faced with recovery after the Great Financial Crisis. Using this analysis, Mecklenburg County should be able to be used in the future as an indicator for how other counties across the country would behave when recovering from major economic shocks (E.g. Covid-19).
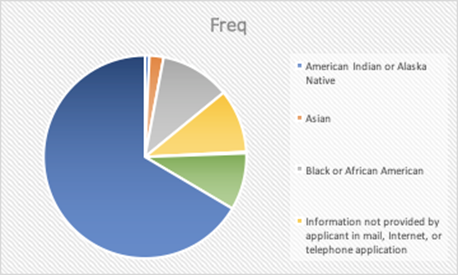
Furthermore, the HMDA dataset also provided data on the race of each loan originator. As expected, the majority of loans that originated in North Carolina over this period were from the White population. This is followed by a close split between both the Asian and Black populations. The results of this frequency analysis were used so that further visualizations can be created which show the discrepancy across certain indicators for race. The benefit of this will be providing greater clarity on where disparities occur in the housing system based upon race. Identifying these disparities can hopefully lead to greater legislation to address the inequities in this system.
Denial rates across races
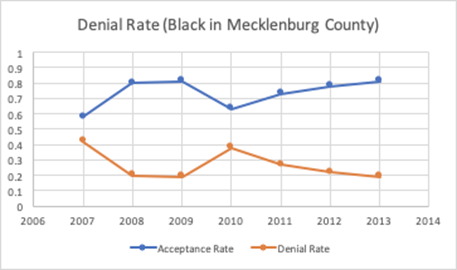
Over the 11 years surveyed, we can see that the denial rates for white vs black populations within Mecklenburg County varied quite substantially. This is an example of the racial profiling that still occurs to this day in areas across the United States. Denial reasons in this instance is a column within the HMDA dataset. There can be several reasons for a denial of a mortgage, and to determine whether each denial was based upon any sort of racial prejudice using the data at hand is near on impossible. However, when aggregating the data and looking at it from a collective, several takeaways prove stark.
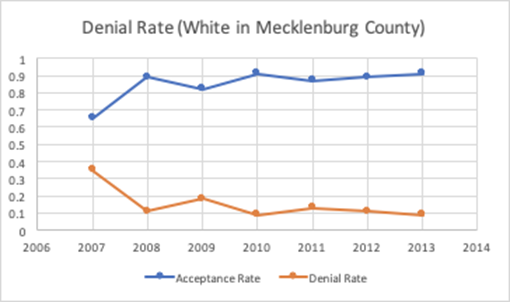
From 2007 to 2017, the average denial rate for a white applicant was 15.1%, whereas the denial rate for a black applicant was 26.7%. This is a significant increase in the denial rate and points to a clear disparity between the two races. Furthermore, another interesting observation is that both the black and white denial rate peaked in 2007. The white denial rate this year was 35%, and the black denial rate was 42%. This is most likely a statistical anomaly – in 2007, lending standards were still much looser as the beginning of the financial crisis, and the ensuing regulations, only began to occur later in that year.
Loan amounts per race

Building on the previous race analysis of Mecklenburg County, we can see that there were also clear differentials regarding the average loan amount for each race. Black Americans had significantly lower loan amounts compared to the white and Asian-American populations. To further compound this, the black population within the Mecklenburg area also saw the smallest increase in average loan amount over these 11 years (37.1%). Comparetivly, the average loan amount for white Americans increased by 40.2%, and 59.6% for Asian Americans.
Conclusion
To summarize, the HMDA dataset provides very interesting initial insights into how North Carolina, and Mecklenburg County specifically, recovered from the 2008 Financial Crisis. Whilst the data used is somewhat limited in the size of the random sample generated and the potential anomalies related to this process, the following visualizations show a state that grew at a relatively fast pace after 2008, especially in the later years of 2014-2017 once strong regulation and housing reform was introduced.
Whilst the data analysis conducted in this report provides useful analysis, future work should be focused on finding more specific data on delinquency and foreclosure rates, to see how those changed over time and whether any correlation can be made between foreclosures and race/geographical region within North Carolina.