by Arjun Bakshi, William Zhao
Fueled by investment property buyers in Las Vegas, the housing bubble in Nevada was pronounced. When the bubble burst, the pain was widely felt. The following are the key findings from our analysis of Nevada housing data.
Finding 1: Nevada had a significant housing bubble. When it popped, home prices and the homeownership rate plummeted.
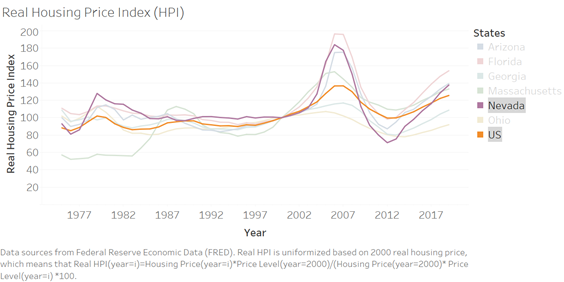
Home prices had been stable in Nevada throughout the 1990s (Figure 1). But, from 2000 to 2007, prices increased by 84%, a rate that far exceeded the national average.[1] Once the bubble burst, prices plummeted in the beginning of 2007, home prices plummeted to a historic low where they remained for many years after the crisis.
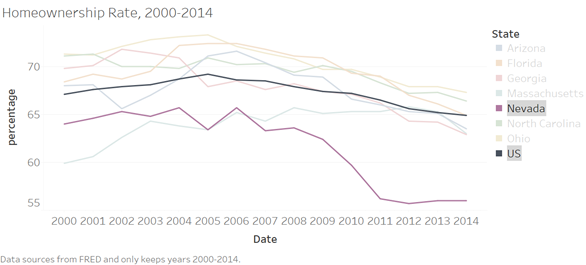
The housing bubble significantly impacted the homeownership rate in Nevada. As shown in Figure 2, the homeownership rate was stable between 2000 and 2006, at about 65%. This rate lower than the national average during this period. When the bubble burst, the homeownership rate plummeted, bottoming out at 56% in 2012, which was far below the national average of 65%. The peak-to-trough decline in home prices and the homeownership in Nevada far exceeded the national average.
Finding 2: There was a widening gap between the average loan amount and applicant income in Nevada, which led to a high level of foreclosures.
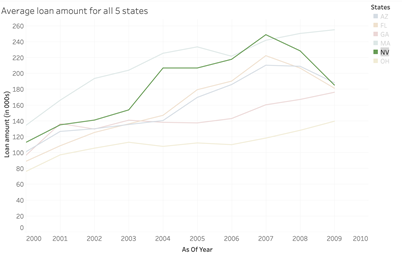
Average loan amounts in Nevada rose dramatically between 2000 and 2007, especially in Clark county, home to Las Vegas and with a population of roughly 2 million (Figure 3). In 2007, the average loan amount in Nevada was just under $250,000 (the highest pre-crisis average loan amount amongst all the states in our sample). When the bubble burst, the average loan amount plunged to $184,000, a 26% decrease.
Figure 4 gives more credence to the unstable nature of Nevada’s pre-crisis housing market. It shows that the ratio of loan amount to applicant income went from 1.5:1 at the beginning of the decade to 2.1:1 in just 7 years. Clearly, lenders in Nevada were extending credit against ever increasing collateral values regardless of the borrower’s income. When the bubble burst, this had a dramatic consequences.

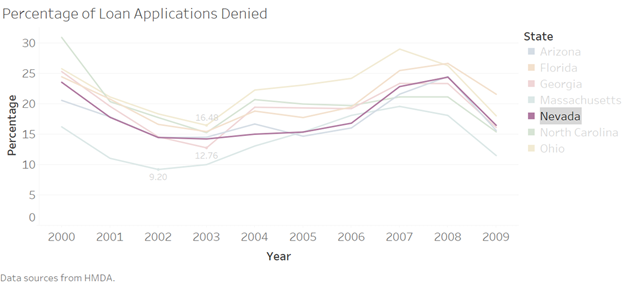
Finding 3: In 2003, the ratio of refinancing loans peaked at 60% and the denial rate reached its lowest point of 14%.
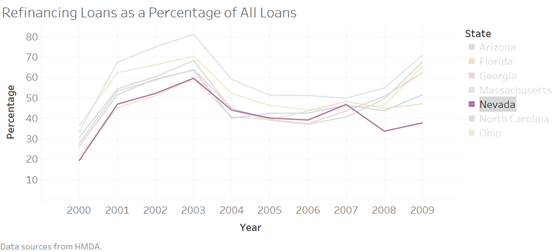
The ratio of refinancing loans to all loans steadily increased in the early and mid-2000’s, peaking at 60% in 2003. The ratio gradually decreased after 2004 and remained stable during the financial crisis between 40% and 50%. This change is likely due to the Federal Reserve increasing interest rates beginning in May 2004, which discouraged refinancings.
The mortgage application denial rate also reached its lowest point in 2003 at 14%. Nevada’s denial rate was average compared to other states we surveyed. Overall, refinancing loans, home purchase loans, and denial rates all experienced a transition in 2004, reflecting the impact of interest rates in the mortgage market.
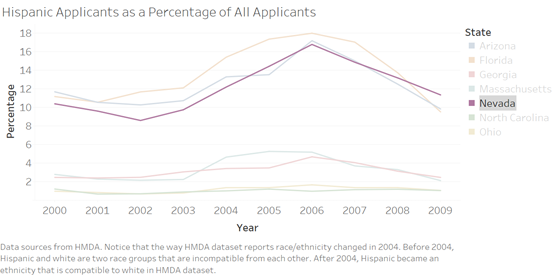
Finding 4: The ratio of Hispanic applicants doubled from 8% to 16% between 2002 and 2006, and then declined during the financial crisis.
Hispanics and Latinos accounted for roughly a quarter of Nevada’s population. Figure 5 highlights how Nevada, along with Arizona and Florida, maintained a large share of Hispanic applicants, and that this share went from 8% in 2000 to 16% in 2006. Anecdotal evidence suggests that Hispanic borrowers were disproportionately targeted by predatory and subprime lenders, which may explain the post-crisis decline in the share of Hispanic applicants[2].
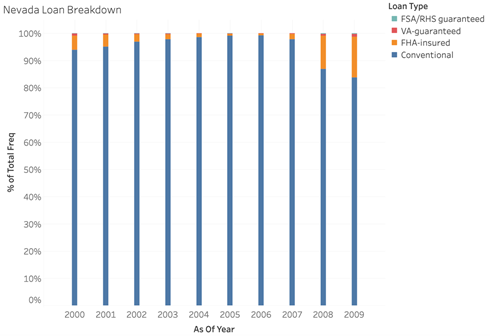
Finding 5: Nevada saw a surprisingly small decrease in conventional loans after the financial crisis.
Further demonstrating the fragility of the housing bubble in Nevada was the number of conventional loans that were being issued before 2008. A conventional loan is a mortgage loan that is not offered or secured by a government entity. They tend to have a higher interest rate since they are not FHA insured (Federal Housing Administration). As observed in Figure 8, the percentage of conventional loans (compared to government insured loans) in Nevada rose from 94% in 2000 to 99.25% by 2006. This rise occurred because banks believed home prices would continue to increase, which gave them license to loosen their credit requirements and issue more mortgages with higher payments to people who ultimately could not afford them[3].
HMDA (Home Mortgage Disclosure Act) data set is a publicly available data set that documents loan data since 1975. In this summary, we use the 2000-2009 HMDA data to generate visualizations that are helpful to the understanding of American predatory lending. After getting the data for each state in each year, a sampling is conducted to contract the size of data so that our laptops can easily carry it. For data of each of the five states in each of the ten years, we randomly select 8,000 rows that represent 8,000 loans. These segments sum up to 80,000 loans for each state over the 10 years period.
[1] The FHFA Housing Price Index (HPI) is a broad measure of the movement of single-family house prices. The FHFA HPI is a weighted, repeat-sales index, meaning that it measures average price changes in repeat sales or refinancings on the same properties. For detailed documentation, click here. When using the data, we adjusted the Housing Price Index by inflation, so that the real HPI visualized reflected real changes in housing price.
[2] Nguyen, Tomson H., and Henry N. Pontell. “Fraud and inequality in the subprime mortgage crisis.” Economic crisis and crime. Emerald Group Publishing Limited, 2011. See also Calem, Paul S., Kevin Gillen, and Susan Wachter. “The neighborhood distribution of subprime mortgage lending.” The Journal of Real Estate Finance and Economics 29.4 (2004): 393-410.
[3] Adelino, M., Schoar, Antoinette., and Severino, F. “The Role of Housing and Mortgage Markets in the Financial Crisis.” Annual Review of Financial Economics. 10.25(2018)