by Arjun Bakshi, William Zhao
Our exploration of Massachusetts mortgage market data in the run up to the financial crisis provides four key findings.
Finding 1: Massachusetts’ housing bubble was more modest compared to other states
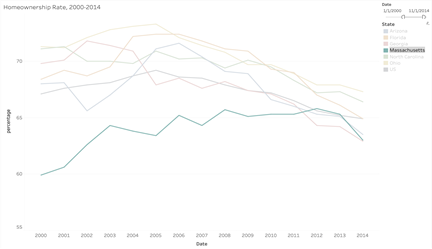
Figure 1 shows how home prices in Massachusetts rose at a more moderate pace compared to Arizona and Florida. Figure 2 shows the homeownership rate between 2000 and 2014 for 6 different states and the US in total. This visualization shows how Massachusetts was the only state with a consistent increase in homeownership, up until 2012. More noteworthy is the fact that in Massachusetts, home prices peaked well before they did in other states and before the housing bubble burst nationally. After reaching their high point in 2005, Massachusetts home prices had a modest decline compared to what occurred in other states when the housing bubble burst. In fact, starting in 2009, the average home price was higher in Massachusetts than it was in the other states in our sample. Furthermore, the homeownership rate in Massachusetts actually went up after the housing bubble burst – the only state in our sample where this was observed.
This and other data points, which we highlight below, indicate that the housing bubble in Massachusetts was far less pronounced when compared to other states and the national average.


Finding 2: Lenders became more aggressive as home prices increased
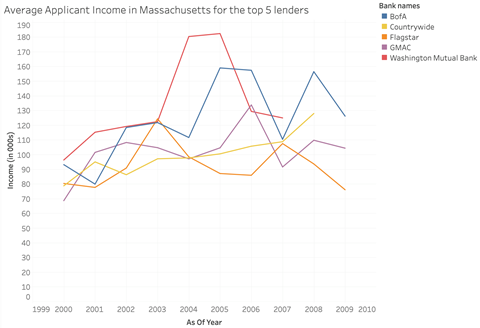
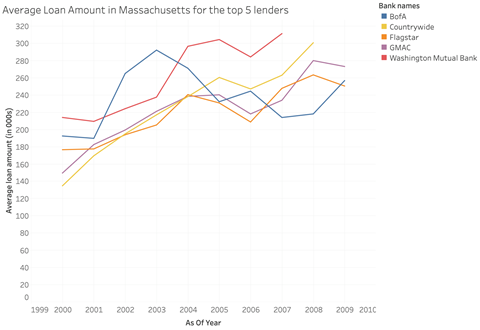
Like other states in our sample, lenders in Massachusetts were more than happy to issuer larger mortgages against the same level of income as home prices steadily increased in the early 2000s.
The 5 most active mortgage lenders in the state were determined by using the “respondent_id” numbers in the HMDA data set. After filtering the HMDA data set by state code (25 for Massachusetts) and for the time period (2000-2009), we sorted the data by the frequency of a respondent_id. We then matched a respondent_id with a financial institution using the HMDA website.
As seen in Figure 3, average applicant income gradually rose in the years leading up to the crisis. For example, the average income for Countrywide applicants rose from $80,000 in 2000 to $108,700 in 2007. This rise in income corresponds to the performance Massachusetts’ economy during this period (GDP increased by $90 billion in the first seven years of the decade). However, average loan amounts in the state increased at a far greater rate. At Countrywide, they grew from $134,600 to $262,000 between 2000 and 2007. Bank of America was the sole lender that did not follow this trend (their average loan amount decreased between 2003 and 2005).
What is interesting to note is that the effects of this pattern in Massachusetts were not as severe as the other states we are visualizing. This will be explored in the next finding.


Finding 3: Delinquency and foreclosure rates in Massachusetts were more modest compared to Sun Belt states.
Figure 5 shows the number of seriously delinquent mortgages for all five states in our sample. A mortgage is classified as seriously delinquent when a payment is at least 90 days past due. At the peak of the crisis, 8.28% of mortgages were seriously delinquent in Massachusetts. For comparison, in Arizona it was 12.21% and in Florida it was 20.43%. Massachusetts also consistently had the lowest number of loans that were classified as seriously delinquent.

One reason why Massachusetts’ housing market was less impacted when the bubble burst was the state’s economy. The unemployment rate in Massachusetts rose by 3.4% from January 2008 to December 2009. In comparison, in both Arizona and Florida, it rose by 6.4% over the same period. Obviously, employment status is a major predictor of a borrower’s ability to pay.
Finding 4: Conventional loans dominated the Massachusetts market

The final finding regarding Massachusetts was the number and nature of the conventional loans that were issued in the state. Throughout the 9 years we analyzed, Massachusetts consistently had the highest proportion of conventional loans, ranging between 94% and 99.25% before the bubble burst. Conventional loans are mortgage loans that are not offered or secured by a government entity. One explanation for such a high percentage of conventional loans was the higher-than-average borrower incomes in Massachusetts. The median household income in Massachusetts rose to $60,320 in 2008, whereas the respective figures in Ohio and Arizona were $46,934 and $46,914. A higher average income meant higher credit scores, which increased the likelihood the borrower qualified for a conventional mortgage.

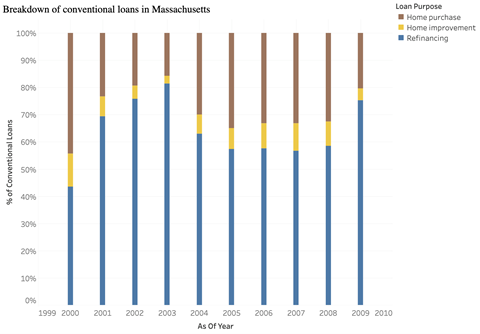
The refinancing ratio peaked in 2003 in Massachusetts (Figure 7). In 2003, 81.46% of conventional loans were refinancings; this number steadily declined, bottoming out at 58.53% in 2008. The refinancing ratio in Massachusetts peaked sooner than it did in other states, which is likely one reason why home prices in Massachusetts peaked earlier (2005) than it did nationally. This phenomenon may be partially explained by the imposition of an anti-predatory lending law in Massachusetts that ….
HMDA (Home Mortgage Disclosure Act) data set is a publicly available data set that documents loan data since 1975. In this summary, we use the 2000-2009 HMDA data to generate visualizations that are helpful to the understanding of American predatory lending. After getting the data for each state in each year, a sampling is conducted to contract the size of data so that our laptops can easily carry it. For data of each of the five states in each of the ten years, we randomly select 8,000 rows that represent 8,000 loans. These segments sum up to 80,000 loans for each state over the 10 years period.