by William Zhao, Arjun Bakshi
A Sun Belt state with a population that is one-third African American, Georgia was targeted by unscrupulous mortgage lenders during the 1990s and 2000s. When the housing bubble burst, all borrowers faced difficult circumstances and defaults skyrocketed .
Below are six findings from our exploration of housing market data in Georgia.
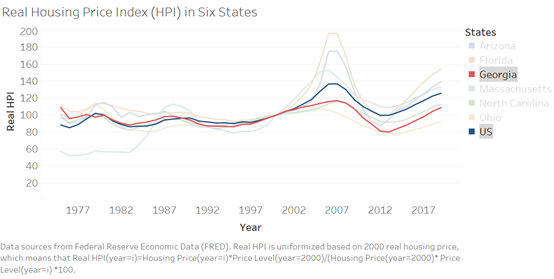
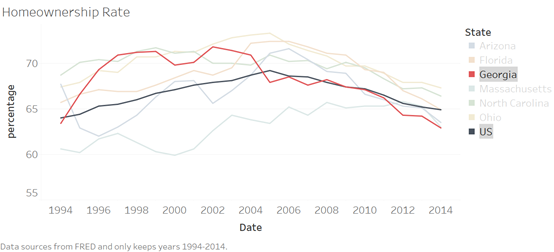
Finding 1: Home prices rose slowly but steadily in Georgia from 1993 to 2006, but the homeownership rate started to decrease in 2001.
The real housing price index in Georgia pre-crisis behaved differently than other states we sampled. Figure 1 shows that home prices started to rise in 1993, which was a few years earlier than in many other states. Home prices in Georgia rose 30% between 1993 and 2006, which was less than a 50% or more increase that occurred over the same period in many other states. Moreover, the rate of increase after 2000 did not accelerate like other states in our sample, which may be the result of lending behavior in the state not changing dramatically in the boom years of the early and mid-2000s, or a more substantial rate of home construction. After 2007, home prices declined in Georgia, with the price index reaching 80 at its lowest point in 2012. Overall, the relatively modest run up in Georgia home prices pre-crisis presaged a more modest decline once the housing bubble burst nationwide.
Figure 2 reveals that the homeownership rate in Georgia reached its peak from 1997 to 2001 at around 70%. It rose rapidly from 1994 to 1998, along with home prices, and remained stable until 2003, before declining. The sudden decrease in the homeownership rate before the housing bubble burst may be due to the Federal Reserve raising interest rates beginning in 2004; higher interest rates make homeownership more expensive. The homeownership rate continued to decline with the onset of the financial crisis in 2008.
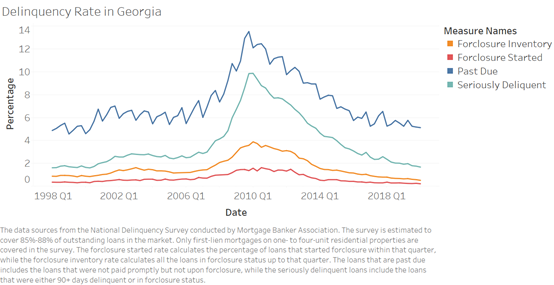
Finding 2: Prior to 2007-08, delinquency and foreclosure rates in Georgia remained stable compared to than other states in our sample. These rates increased dramatically beginning in 2006.
The seriously delinquent rate remained roughly 2.5% between 2000 and 2006, while the foreclosure started rate was around 0.5%. These rates were much higher compared to some other states (the seriously delinquent rate in Florida was 1.1% and the foreclosure started rate was 0.2% in the first of 2006). Starting in the first quarter of 2006, the delinquency and foreclosure rates in Georgia started to rise, reaching their peak in the first quarter of 2010, with a seriously delinquent rate of 10%. While high, the seriously delinquent rate in Georgia, at its peak, was still far lower than in many other states (in Florida the rate was 20% in 2010 Q1). The foreclosure inventory also reached its peak of 4% in the first quarter of 2010.
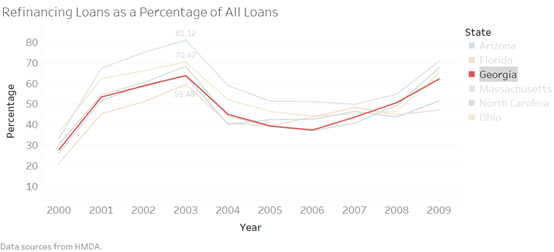
Finding 3: The ratio of refinancing loans to all residential mortgage loans peaked in 2003, and denial rates reached their lowest point in 2003.
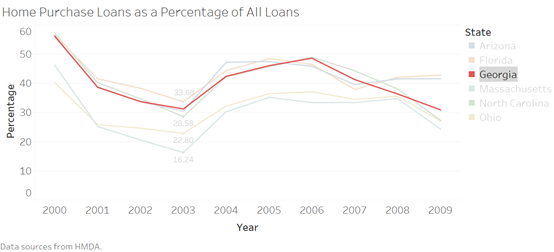
Figure 4 shows that the proportion of refinancing loans issued was increasing at the start of the decade and reached a peak of 60% in 2003, before decreasing in 2004 and then stabilizing during the financial crisis at a level between 40% and 50%. As the proportion of home purchase loans are the inverse to that for refinancing loans, the ratio of home purchase loans reached its lowest point in 2003 and then rose thereafter. As in other states, the decline in the proportion of refinance loans can be attributed to the Federal Reserve raising of interest rates. Compared to other states, Georgia’s refinancing ratio was a little lower.
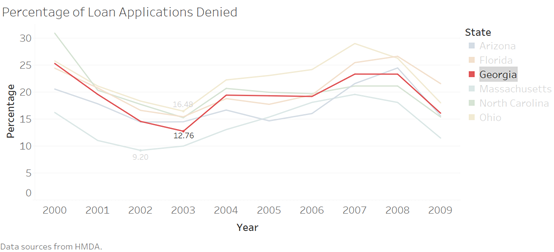
The denial rate in Georgia also reached its lowest point in 2003 at 13%. The rate rose afterwards, and remained around 20%. The denial rate in Georgia was average compared to other states. Overall, the proportion of refinancing loans and home purchase loans and the denial rate all experienced a transition in 2004, reflecting the impact of interest rate adjustments.
Finding 4: The proportion of black mortgage applicants increased from 2001 to 2006, and the proportion of investor property loans increased from 2003 to 2006.
Due to explicit and implicit racial bias in the mortgage industry, African Americans have historically struggled to gain access to mortgage credit and often confronted predatory lending practices in the years leading up to the financial crisis.[1]
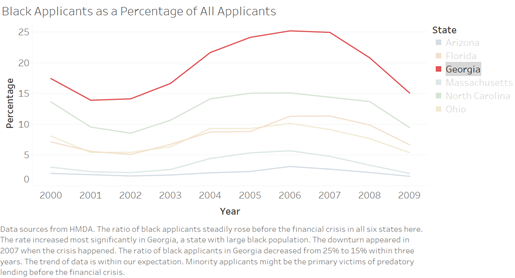
Figure 7 shows that the percentage of Georgia loan applications filed by black applicants increased from 2000 (15%) to 2006 (25%). Once the bubble burst, black applications fell back to 15% in 2009. The rapid expansion of black applicants implies that African Americans were major contributors to the pre-crisis run up in home prices in Georgia. It may also indicate that African Americans were disproportionately targeted by predatory lenders. Even at the peak of the bubble, the proportion of African-Americans among mortgage seekers remained far below their share of Georgia’s overall population.
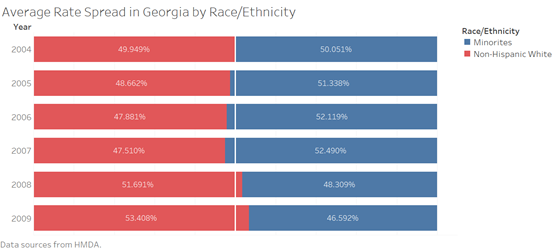
The effect of subprime lending on minorities can be seen in the different rate spreads white and black borrowers pay (Figure 8). Rate spread is the difference between the actual loan interest rate and the standard loan interest rate, and is only reported for higher-priced loans (defined as mortgage loans with an annual percentage rates higher than a benchmark rate called the Average Prime Offer Rate) in HMDA. HMDA does not include borrower credit scores, which makes it difficult to control for borrower riskiness (riskier borrowers get higher interest rates) but the persistently higher pre-crisis rate spread for minority borrowers in Georgia, compared to white borrowers, points toward possible discrimination in the mortgage market. This difference in rate spread flipped after the bubble burst, which may have been caused by the decisions of poorly capitalized subprime lenders, which previously targeted minority borrowers, to pull back or leave the market entirely.
Finding 5: Borrower debt burdens increased in the years leading up to the financial crisis.
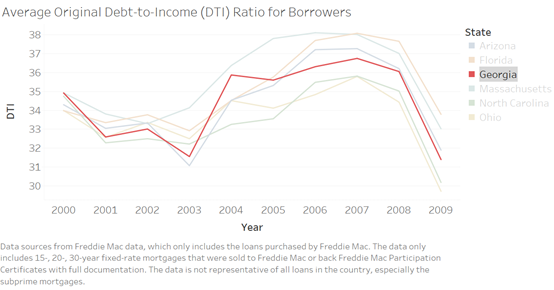
Figure 9 displays the original debt-to-income (DTI) ratio of borrowers in Georgia. In other all states, this ratio increased significantly beginning in 2003. In Georgia, the debt-to-income ratio rose from 32% in 2003 to 37% in 2007, with the most dramatic increase happening in 2004. The higher DTI may have been caused by refinancings, which typically raised the total loan amount and the debt service each month, especially when borrowers took advantage of rising real estate prices to extract equity at closing. Like in other states, the debt burden became unsustainable once home prices declined and borrowers no longer had the option of refinancing.
Figure 10 shows the proportion of higher-priced loans in Georgia, which increased from 2004 to 2006, from 8% to 13% (this data was not available in HMDA prior to 2004). The increase in higher priced loans led to a greater overall debt burden for borrowers and may indicate that predatory lending practices were becoming more prevalent immediately prior to the crash.

Finding 6: The percentage of investor property loans and conventional loans increased from 2001 to 2006 and declined thereafter.
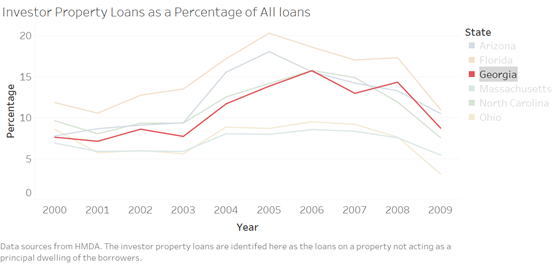
Investor property loans used to purchase second homes and investment properties accounted for a larger percentage of mortgage loans in Georgia from 2001 to 2006. The percentage peaked at 15% in 2006 and declined to 8% in 2009 after the bubble burst. Investment property buyers certainly contributed to Georgia’s pre-crisi home price appreciation but it is unlikely they were targeted by subprime lenders in any significant way.
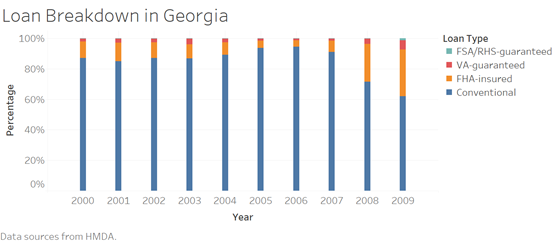
Unlike “conforming loans,” “conventional loans” are not guaranteed or insured by the Farm Service Agency (FSA), Rural Housing Service (RHS), Veterans Administration (VA), or Federal Housing Administration (FHA). While guaranteed or insured loans are typically high-quality prime loans, more than 90% of the loans issued in Georgia were conventional loans during the years leading up to the financial crisis. Moreover, the percentage of conventional loans in Georgia increased between 2001 and 2006, where it peaked at 94%. However, conventional does not mean quality, and when the housing bubble burst, it became clear that conventional underwriting standards nationwide had been declining for some time.
[1] Nguyen, T. H., & Pontell, H. N. (2011). Fraud and inequality in the subprime mortgage crisis. In Economic crisis and crime. Emerald Group Publishing Limited.