by William Zhao, Arjun Bakshi
The housing bubble in Florida was quite pronounced – likely due to the prominence of investors who bought second homes in the state – which accentuated the downturn when the national market collapsed. As a result defaults in Florida exceeded the national average and the default rate in other states in our comparison group.
Below are seven key findings from our exploration of Florida housing market data.
Finding 1: A large housing bubble existed in Florida from 2000 to 2007.
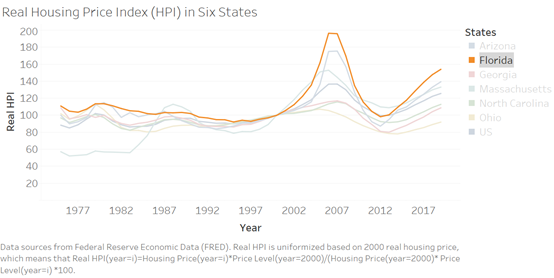
Home prices had been relatively stable in Florida prior to 2000. Then, housing prices increased by 96% from 2000 to 2007, with the real Housing Price Index (HPI) rising from 100 to 196, exceeding the increase in most other states and the national average. After the bubble burst in the beginning of 2007, home prices plummeted and returned to 2000 levels by 2012.
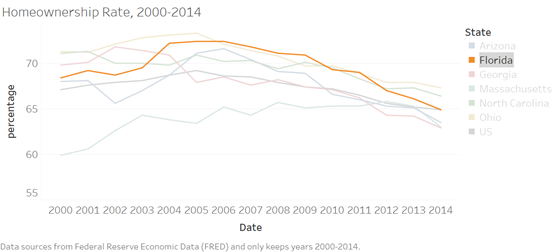
As shown in Figure 2, the homeownership rate in Florida increased from 2000 to 2006, peaking at 72% in 2006. When the bubble burst, the homeownership rate fell significantly, bottoming out at 65% in 2014, which was lower than it was in 2000 and on par with the national average, even though Florida’s homeownership rate exceeded the national average before the housing bubble started to inflate.
Finding 2: Loan defaults were high in Florida.
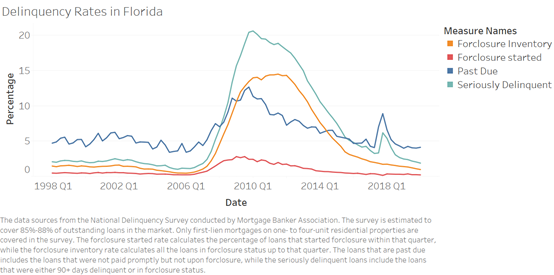
In the early 2000s, the delinquency and foreclosure rates in Florida began to steadily decline, and by 2006, the seriously delinquent rate measured 1.1% and foreclosure inventory 0.5%. In the middle of 2006, foreclosure and delinquency rates began an upward march, signaling the onset of the housing market collapse in Florida. The seriously delinquent rate went from 2% in the first quarter of 2007 to 20% in the first quarter of 2010, which marked the post-crisis peak.
Compared to other states, Florida began the crisis with lower delinquency and foreclosure rates and ended the crisis with much higher rates. For example, the seriously delinquent rate in Georgia was around 2.5% from 2000 to 2006 (compared to 1.1% in Florida) and 9.8% at its peak (compared to 20% in Florida). This pattern is consistent with the rapid runup in Florida home prices during the boom. Low delinquency rates pre-2006 were aided by appreciating home values, thereby ensuring borrowers could always refinance if they encountered any difficulty in making their monthly mortgage payment. Once home prices declined, refinancing was no longer an option, and defaults and foreclosures skyrocketed.
Finding 3: Investor property loans accounted for a large proportion of mortgage loans in Florida, and Hispanic applicants filed for a large percentage of loan applications.
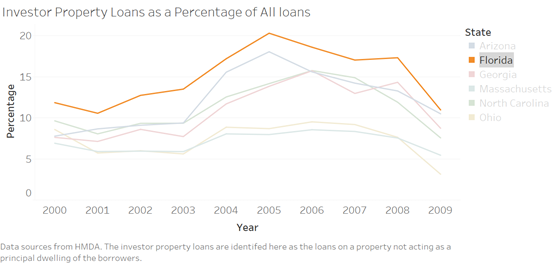
Florida has long been a popular destination for retirees and vacation homeowners. Investor property loans used to purchase second homes and investment properties accounted for an increasing share of all mortgage loans in Florida from 2001 to 2005, reaching its peak of 20% in 2005. Florida has always had a larger percentage of investor property loans than other states, and this buyer segment played a big role in driving home prices up in Florida pre-crisis.
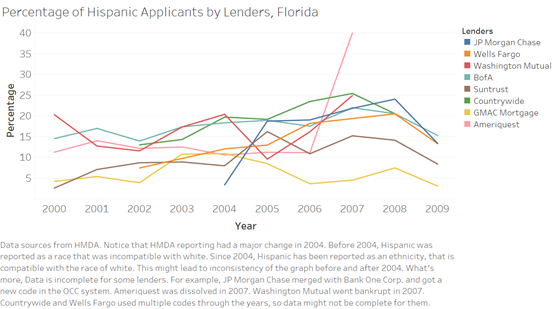
Florida also has a large Hispanic population. Figure 4 highlights how Florida, along with Arizona, maintained a large share of Hispanic applicants, and that this share went from 10% in 2000 to 20% in 2006. Anecdotal evidence suggests that Hispanic borrowers were disproportionately targeted by predatory and subprime lenders, which may explain the post-crisis decline in the share of Hispanic applicants.

Finding 4: Ratio of refinancing loans peaked in 2003, and the denial rate reached its lowest point in 2003.
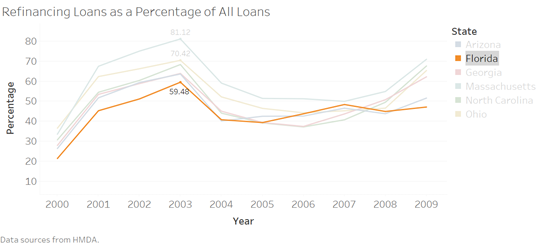
The ratio of refinanced loans to all loans steadily increased in the early and mid 2000’s, peaking at 60% in 2003. The ratio decreased in 2004 and remained stable during the financial crisis between 40% and 50%. Conversely, home purchase loans reached its lowest point in 2003 and then rose afterwards. This change is likely due to the Federal Reserve increasing interest rates beginning in May 2004, which discouraged refinancing.
Compared to other states, Florida always had a lower ratio of refinancing loans and a higher ratio of home purchase loans. Some other states had a refinancing ratio of 70%-80% at its peak. This discrepancy may be due to the number of vacation homes purchased in Florida during this period.
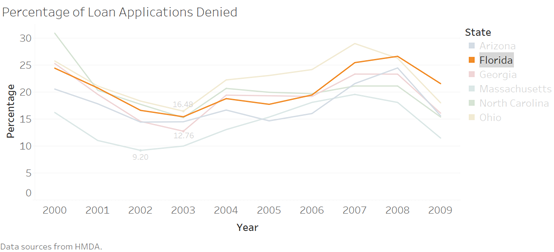
The mortgage application denial rate also reached its lowest point in 2003 at 16%. Florida’s denial rate was average compared to other states we surveyed. Overall, the prevalence of refinancing loans, the fraction of home purchase loans, and denial rates all experienced a transition in 2004, reflecting the impact of interest rates in the mortgage market.

Finding 5: Lenders behaved differently, but Ameriquest was an outlier.
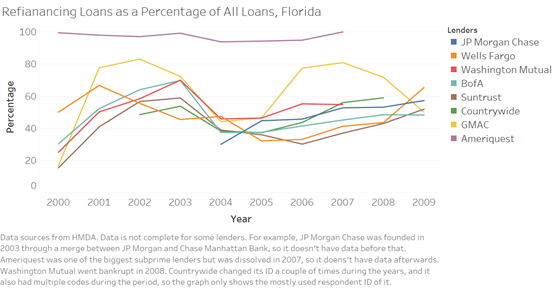
Figures 9 and 10 focus on the performance of several major lenders in Florida according to the scale of their mortgage business and their treatment of Hispanic applicants. While the data on lenders needs to be evaluated with care due to problems with the accuracy of HMDA data, it is clear that certain lenders behaved differently than others. Overall, most lenders received an increasing number of applications from Hispanics between 2001 and 2006. For example, Hispanics filed 15% of Bank of America’s applications in 2000 but 20% in 2005. Countrywide and Bank of America received more applications from Hispanic applicants than other lenders, with a ratio of about 20% throughout the boom years. Due to network effects, one might expect Hispanic applicants, like other affinity groups, to prefer some lenders. In this period, Countrywide’s marketing emphasized its commitment to expanding homebuying for demographic groups with comparatively low rates of homeownership.
As for the ratio of refinancing loans, most lenders behaved similarly, and the ratio of refinancing loans peaked in 2003. However, Ameriquest was clearly an outlier, with its business consisting almost exclusively of refinanced loans (the refinancing ratio was 40% to 60% for most other lenders). Ameriquest was involved in several lawsuits in 2005 and 2006 over its predatory lending practices, which compelled the company’s dissolution in 2007.
Given Florida’s soaring home prices pre-crisis, lenders began issuing higher value loans. Therefore, there is no discernible trend in average loan to value ratios amongst the lenders we sampled. The one outlier is Wells Fargo, who beginning in 2003, saw a rapid spike in the average loan to value ratio. This finding is most likely due to a business decision to transition away from refinancing loans to purchase loans.

Finding 6: Most loans issued in Florida were conventional loans, and the ratio of conventional loans kept increasing in 2001-2006.
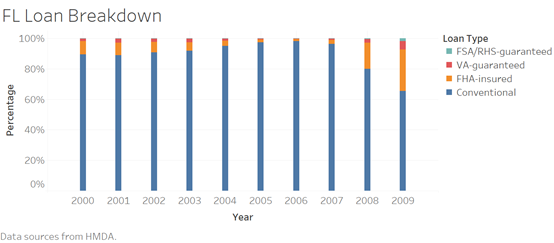
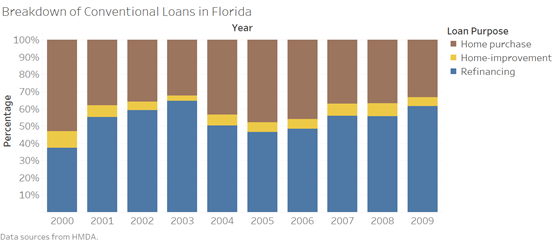
Unlike “conforming loans,” “conventional loans” are not guaranteed or insured by the Farm Service Agency (FSA), Rural Housing Service (RHS), Veterans Administration (VA), or Federal Housing Administration (FHA). While the guaranteed or insured loans are typically high-quality prime loans, more than 90% of the loans issued in Florida were conventional loans during the years leading up to the financial crisis. Moreover, the percentage of conventional loans kept increasing in Florida between 2001and 2006, reaching a peak of 98% in 2006. Since conventional loans accounted for such a high percentage of loans in Florida, it is not surprising that the refinancing ratio amongst conventional loans mirrors the refinancing trend for all loans in Florida. The conventional loan refinancing peak was in 2003, and the ratio remained stable at 40% to 50% until the financial crisis.
Finding 7: Borrowers’ debt burden increased pre-crisis.
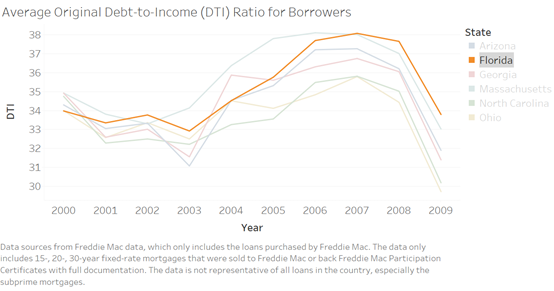
Figure 14 displays the average debt-to-income ratio in several states. The ratio increased significantly beginning in 2003 in almost all states. Specifically in Florida, the debt-to-income (DTI) ratio rose from 33% in 2003 to 38% in 2007. By the time the bubble burst, the DTI ratio for Florida borrowers exceeded the other states in our comparison group. It is possible that the higher DTI was caused by a large number of refinancing loans, which typically raised the total loan amount in this period because so many refinancing homeowners availed themselves of the opportunity to extract equity, and so increased their monthly debt burden. The increasing debt burden became unaffordable and led to high default rates when the housing bubble burst.
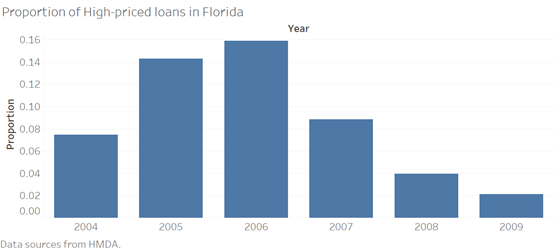
Figure 15 shows the proportion of higher-priced loans (defined as mortgage loans with an annual percentage rates higher than a benchmark rate called the Average Prime Offer Rate) in Florida, which doubled from 2004 to 2006, from 8% to 16%. Since the data was collected starting from 2004, it is unclear whether the proportion was increasing before 2004. Nevertheless, the increasing appearance of higher interest rate loans implied an increasing debt burden for borrowers. It also implies that mortgage rates were higher overall, which may be due to the prevalence of predatory lending practices.
