by Arjun Bakshi, William Zhao
Our 5 key findings reveal how Arizona was one of the worst affected states when the housing bubble burst. When the crash occurred in 2008, the data shows steep drop-offs in almost every mortgage metric, including average applicant income, average loan amount, and the number of conventional loans issued.
Finding 1: The scale of Arizona’s housing bubble was large
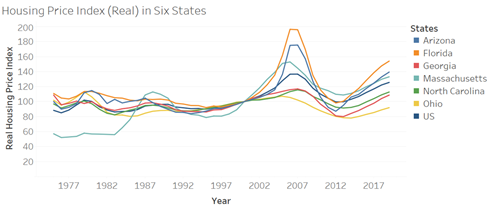
As seen in Figures 1 and 2, there was a steady rise in home prices across all 5 states in our sample between 2000 and 2007. In Arizona, the average sale price rose from $100,000 in 2000 to $217,300 in 2007. The trend in Arizona mirrors what happened in the rest of the country, but in Arizona the increase in prices was more sudden and the decline more precipitous.


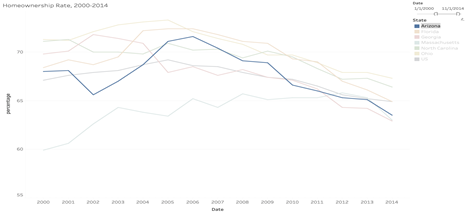
The consequences of a popped housing bubble in Arizona can be clearly seen in the homeownership rate (Figure 2). Arizona did not have the highest homeownership rate pre-crisis but it did experience the largest drop-off from 2006 to 2009 and didn’t bottom out until 2014, at which point it had fallen 8.10% from its pre-crisis peak.
Finding 2: Mortgage lenders in Arizona were aggressive.
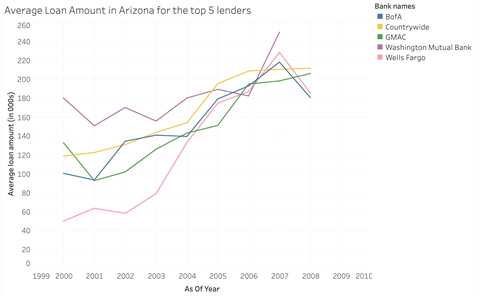
To understand why Arizona was severely impacted by the 2008 Financial Crisis, it helps to know who the main mortgage issuers in the state were and how their activity changed between 2000 and 2009. Figure 3 shows of the 6 largest loan issuers in the state; one caveat is that both Washington Mutual Bank and Countrywide Loans ceased operating in 2007 and 2008 respectively, thus not permitting a full dataset.
The top 6 lenders were determined by using the “respondent_id” numbers in the HMDA data set. After filtering the HMDA data set by state code (25 for Massachusetts) and for the period (2000-2009), we sorted the data by the frequency of a respondent_id. We then matched a respondent_id
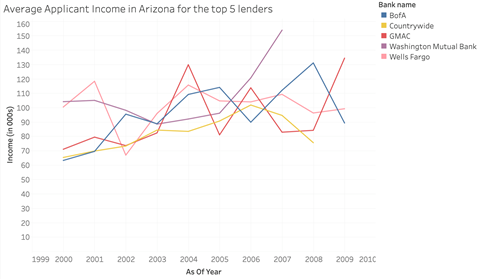
What is interesting is the extent to which the loan amount increased from 2000 to 2007 across almost every institution. A common interpretation for these results is that it mirrors the behavior of the economy; over the same time span, US GDP increased by $4.2 trillion. However, as seen in Figure 4, there is no clear correlation between median applicant income and loan amount, or even median applicant income across institutions. Take Countrywide Loans for example, average applicant income increased by 44% but loan amounts increased by 79%. Wells Fargo is a more extreme example. There, average loan amounts increased by $178,400 (363%). Wells Fargo’s activity in the southwest United States has been clouded by recent allegations that they falsified certain borrower information during this period.
Lender behavior pre-crisis ensured that when the bubble burst in Arizona, homeowners would not be able to make their monthly mortgage payment. Foreclosures skyrocketed as a result.


Finding 3: Delinquency and foreclosure rates skyrocketed in Arizona
Figure 5 underlines the impact that aggressive growth by large lenders in Arizona had on homeowners once the bubble burst.

The number of mortgages that were considered “seriously delinquent” – meaning payments had not been made for at least 90 days – increased from 1% at the start of Q1 2007 to 13.20% by Q4 2009. In Arizona, home prices rose much faster than wages, which, combined with the jump in unemployment that occurred during the crisis, meant that many Arizona homeowners could no longer afford their monthly mortgage payment.
The rise in delinquency rates led to a greater number of foreclosures. Foreclosures typically take place if a homeowner has missed several mortgage payments and has been considered delinquent for an extended period. As unemployment rose, the number of foreclosures went from 0.54% to 6.07% between 2000 and 2007.
Finding 4: Conventional loans dominated the Arizona market

The number of conventional loans issued pre-crisis in Arizona further underscores the fragility of the state’s mortgage market at the time. A conventional loan is a mortgage loan that is not offered or secured by a government entity. They tend to have a higher interest rate since they are not FHA insured (Federal Housing Administration). As observed in Figure 6, the number of conventional loans in Arizona rose from 85.20% in 2000 to 98.20% by 2006. This again was driven by large mortgage lenders who ramped up their activity in Arizona during this time. Banks were under the false impression that the housing market would continue to rise and that if a borrower every got into trouble, they could easily refinance using the equity that had accumulated while home prices rose. As a result, lenders relaxed their credit requirements and issued larger mortgages that came with higher payments to borrowers who ultimately, could not afford them.
When the market did collapse in 2007, lenders pulled back and tightened their underwriting standards. As a result, the number of conventional loans issued drastically decreased, falling by over 36%. This also meant that more loans were being issued by the FHA, who has historically served first time homebuyers and low-to-moderate income borrowers.
HMDA (Home Mortgage Disclosure Act) data set is a publicly available data set that documents loan data since 1975. In this summary, we use the 2000-2009 HMDA data to generate visualizations that are helpful to the understanding of American predatory lending. After getting the data for each state in each year, a sampling is conducted to contract the size of data so that our laptops can easily carry it. For data of each of the five states in each of the ten years, we randomly select 8,000 rows that represent 8,000 loans. These segments sum up to 80,000 loans for each state over the 10 years period.