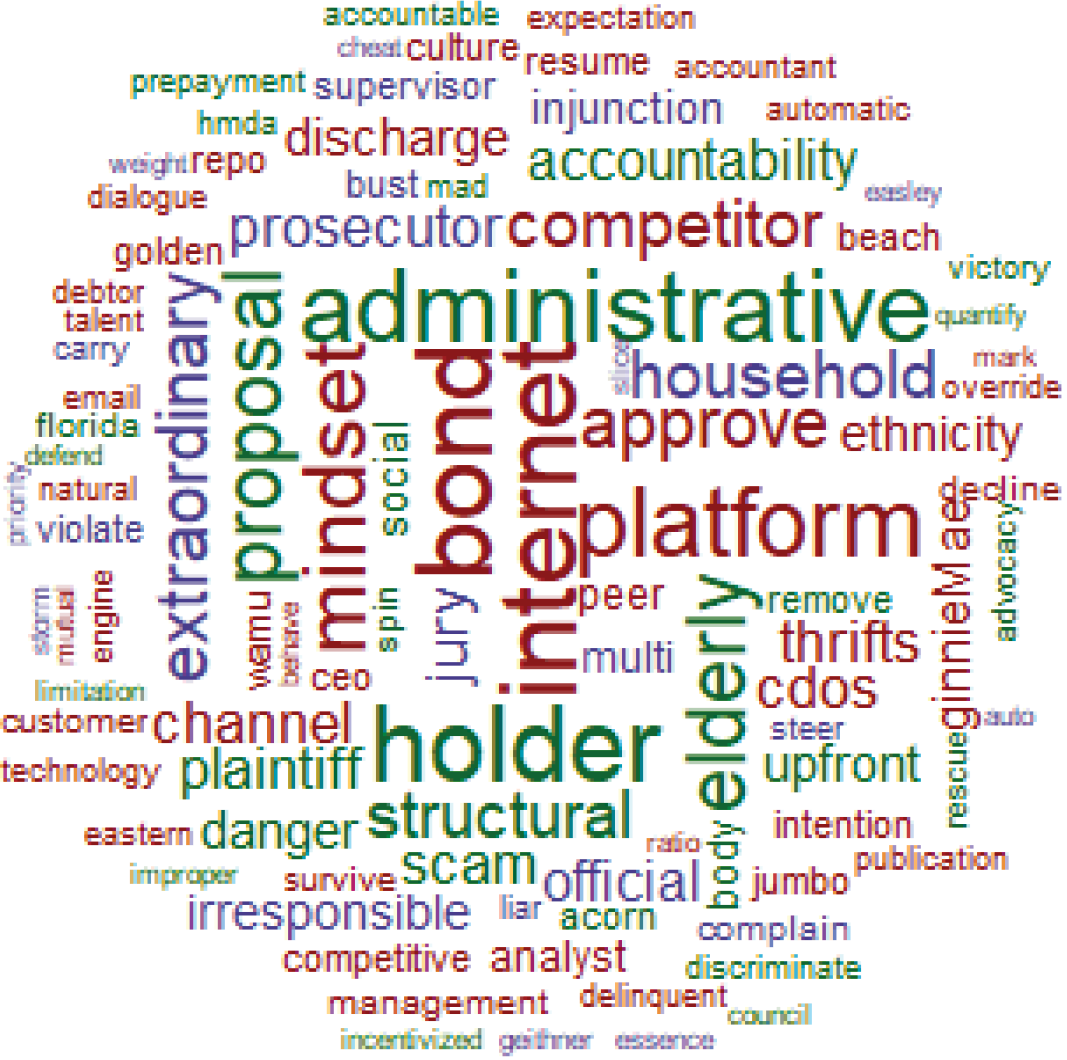
Our analysis displays how three sets of stakeholders – government policymakers, consumer advocates, and banking executives – spoke about aspects of the financial crisis. The data come from a set of over 40 interviews that our team has conducted with individuals from these three groups about state-level mortgage markets and regulatory policy in the run up to the financial crisis. We assign each interviewee to a stakeholder set based on their primary career experience. We then use the variation in mentions of topics, features, and adjectives describing the crisis across the stakeholder sets to show the relative importance each stakeholder set placed on certain words.
We wished to identify what features of the crisis and its genesis were particularly prominent in the commentary offered by individuals in each set of stakeholders. Our analysis displays those aspects of the crisis that appeared significantly more frequently in interviews of one set of stakeholders, relative to the other two sets of stakeholders.
We begin by normalizing each set of stakeholders for the number of interviews within each set.1 We remove words such as location and company names that appear frequently, but reflect the sampling effect of our set of interviewees rather than a generalizable sentiment around the financial crisis.2 We finally rank order all words by the relative prominence in one of the three stakeholder sets relative to the other sets.3 A word that appears with similar frequency in all three sets would not appear in our analysis. Such examples include common colloquial words concerning the crisis (e.g. loan, mortgage, bank) or words where each set of stakeholders used similar terminology in their explanations for the financial crisis.4 What we capture instead is the outsized effect of something that one set of stakeholders had a much greater likelihood of highlighting. Consequently, our analysis does not feature words from each set of stakeholders evenly – words spoken by government policymakers turned out to be less distinctive than words spoken by banking executives and consumer advocates.5

We discuss our results below by stakeholder group.
In the government policymaker stakeholder set, our results include irresponsible,6 extraordinary, liar, cheat, violate, multi, and siloes. Several of these words (irresponsible, liar, cheat, violate) may ascribe blame or fault to institutional actors and other parties. This theme is clear in passages from our underlying oral histories. One example of this theme comes from the interview of Richard Cordray, former Director of the CFPB, who explained, “A growing number of foreclosures were being caused — it appeared — by bad mortgages, predatory mortgages, irresponsible mortgages. And that became a full-blown crisis that eventually led to the financial crisis in the entire nation.” Cordray went on to note that “this new wave of irresponsible predatory lending started somewhere in the country and then gradually moved to other areas.”
A second theme in the results from our government policymaker set involves mechanisms of regulatory oversight that struck interviewees either as effective or problematic. Appearing within our results are multi and siloes, which interviewees used to describe the complex relationship between federal and state regulators. Sometimes the point was to stress constructive coordination, as in the multi-state class actions pursued by many Attorneys General against large-scale predatory lenders. To this point, Alan Hirsch, former NC Deputy Attorney General, explained in his interview: “we had many, many multi-state groups on virtually every subject that you can imagine across state lines. So there was a great deal of cooperation because [of the failure of] the federal government.” But on other occasions, interviewees emphasize the lack of coordination, or even information sharing. Thus, in commenting on the differences between regulatory work at the state and national levels, Sarah Bloom Raskin, Maryland’s banking commissioner in the years leading up to the crisis, observed that, “when you work at the federal level…[y]ou actually get engrossed in a different set of silos where you sometimes stop keeping your eyes open, and then you don’t see what’s going on.” Our analysis identifies these trends as uniquely prominent in descriptions by interviewees in our government policymaker stakeholder set.
Compared to the other two groups, banking executive disproportionately used such words as internet, mindset, channel, platform, approve, and competitor. These interviewees focused more on the evolution and digitization of the mortgage market in the decades preceding the financial crisis. While this result may presently reflect the smaller sample size of our banking executive stakeholder set, and the presence of eCommerce and online lending executives in that set, it suggests a greater awareness and emphasis on the impact that technological transformations had on the lending environment. For example, Lawrence Baxter, Wachovia’s Chief eCommerce Officer, remarked: “I can’t say directly whether the internet was changing [Wachovia’s] thinking [around online banking]. I suspect it was. You certainly got lots of inquiries and we certainly got a lot of support once they adopted the internet in offering the products online. But exactly how that all shifted in the mindset there […] I think it was a sliver of the more complex picture.” Automated underwriting software improved the efficiency of the origination process in the 1990’s, but also opened avenues for some of the fraud seen leading up to the financial crisis. The internet and digitization generally expanded pathways for new competitors including a rise in brokered-loans in the 2000s and the more recent expansion of the share of originations by nonbank lenders. These types of trends were prominent in the descriptions offered by our sample of banking executives as compared to the other two stakeholder sets.
The distinctive words used by interviewees in our consumer advocate stakeholder set include structural, plaintiff, defend, improper, accountability, elderly, danger, and scam. Consumer advocates deployed these descriptors to ascribe blame for the damage of the financial crisis. Certain words highlighted by consumer advocates – such as improper and scam – targeted the practices of lenders. In response to a question on working with clients who faced foreclosure, Jeffrey Dillman, the former Director of the Housing Research and Advocacy Center, commented that: “in certain ways it reinforced what I thought … that our society has a lot of inequality and that certain people have a lot more wealth and power than others … And … how to address it is a challenge because the problem is structural.” Separately, Jeff Hearne, who was the Director of Litigation at Legal Services of Greater Miami, remarked on the protection of borrowers: “I think there’s blame to go around everywhere. But I feel like that really is the government’s job, to make sure that these sort of scams don’t happen. And so I sort of put the blame on the lenders and the lack of government oversight.”
This novel empirical contribution adds to the extant understanding of how different stakeholders varied in their portrayal of the financial crisis. Our dataset offers opportunities for additional research. First, this word cloud will be updated as our body of oral histories grows. Second, we applied the same analytical approach described here to a prompt asked in each oral history of how an interviewee views the genesis of the financial crisis.
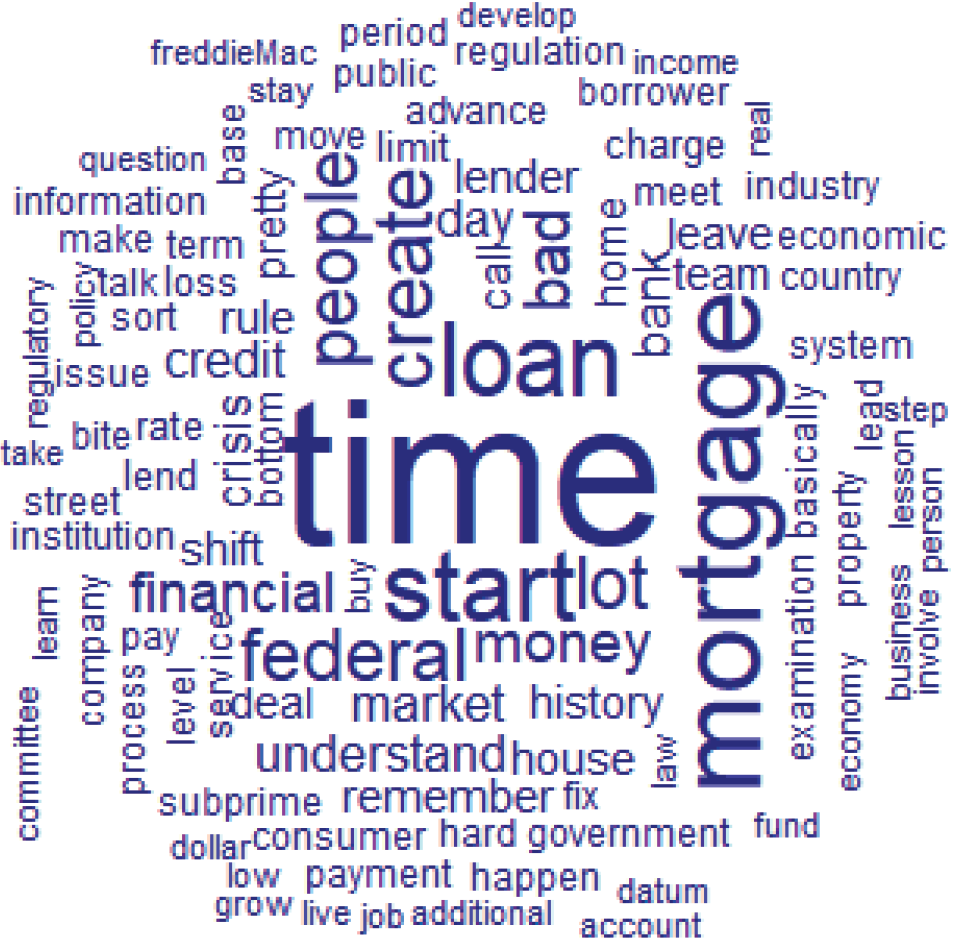
We generated a word cloud of the most shared words between stakeholders in their descriptions in the interviews. To generate these results, we designed a metric that allows us to extract the most shared words across all three stakeholder sets, weighted by a word’s prevalence.7 Here we see common phrases relating to the financial crisis: bank, loan, mortgage. We additionally observe descriptors attached to major themes from the crisis. For example, bad, regulatory, subprime, and time all appear within these results. This analysis shows us the convergence in descriptions by interviewees on many well-known, high-level themes, and the stark contrast between these shared descriptions and the more targeted, stakeholder- specific descriptions in our primary results.

1 To normalize, we take each word within a stakeholder set – government policymakers, consumer advocates, and banking executives – as a portion of the total words in that stakeholder set.
2 We also remove the common words which carry little contextual significance (e.g. above, the, or), we stem all words, and we limit our corpus to words spoken by the interviewee (i.e. removing the words in the questions spoken by the interviewer).
3 Specifically, we identify the set of stakeholders with the maximum references to each word in our corpus. We then calculate the percent increase in the mentions by that stakeholder set over the average of the other two stakeholder sets.
4 In the Appendix we show a word cloud of the most similar terminology used across all stakeholder sets. The results from this word cloud of similar terminology include common words relating to the financial crisis (i.e. bank, mortgage) and common themes from the financial crisis (i.e. regulation, credit, bad, and subprime, among many others).
5 For example, of the 100 words in the word cloud, the results do not reflect an even 33-33-33 split of words from stakeholder sets. The results reflect the top 100 words with outsize mentions in one stakeholder set relative to others.
6 We see a strong case for further examination of references to “irresponsible behavior” or “irresponsibility” in the interviews as a whole, distinguishing which parties an interviewee identified as the relevant actors.
7 Our “similarity metric” for a word set (the number of mentions by each stakeholder set for a given word) is the inverse of standard deviation ÷ average, then multiplied by the average, where each term is applied to the word set. The standard deviation provides a basic measure of dispersion. However, larger word sets implicitly have larger standard deviations, even when relative distances are the same. For example, a set of 3-4-3 and a set of 300-400-300 have standard deviations of 0.47 and 47.1, respectively. This fact prevents us from adequately comparing the similarity of large sets and small sets. We solve this issue by dividing by the average of the set. In the example, this results in values of 0.14 in each set. We take the inverse of this result as a simplifying step, to allow sets with higher similarity to yield higher values. Finally, our results thus far are not weighted for prevalence. We multiply by the mean value of each set to weight for prevalence of a word. In our example, this yields a similarity metric of 24 and 2,357 for each set, respectively.